
Contemporary scientific and non-scientific community points out the importance of a healthy lifestyle, including an adequate amount of minerals such as calcium, magnesium or phosphorus [1-3]. These elements are related to food, drinking water and other drinks (e.g. milk, etc.) and their abnormal/inadequate intake is reflected in the mineral metabolism anomalies, negative cardiovascular and neurologic outcomes, development of kidney stones, etc. in both pediatric and adult population [4-6]. A higher osteoporotic fracture risk under certain circumstances that also involves a dysregulation of the vitamin D status and/or parathyroid hormone (PTH) has been reported, too [7-12]. In addition, an abnormal magnesium/calcium intake disturbs their serum and cellular balance during pregnancy, further displaying, not only maternal consequences, but, also, a negative impact on the newborn (e.g. eclampsia/pre-eclampsia, pregnancy-related diabetes mellitus, on one hand, and, on the other hand, restriction of the intra-uterine growth, preterm birth, and metabolic/mineral ailments during early childhood) [13-16].
In addition to the dietary consumption and the connected reflection in the metabolic and mineral pathways, the calcium-to-magnesium ratio is also analyzed in the serum according to their circulating levels (mostly involving total serum calcium, not ionized calcium), the ratio being studied in patients with metabolic syndrome, primary hyperparathyroidism, osteoporosis, nephrolithiasis, etc. [17-20]. Moreover, the circumstances that alter the digestive absorption and the overall metabolism of calcium and magnesium may be related to a glucocorticoid excess, such as endogenous or exogenous Cushing’s syndrome, which associates an impairment of the bone status and of the cardio-metabolic risk [21-25]. However, the data in mild cortisol excess, as found in patients with adrenal incidentalomas, remain scarce, while the condition has an increasing incidence due to an easy access to abdominal scans, thus the importance of analyzing alternative biomarkers, such as those easy-to-access e.g. calcium-to-magnesium ratio [26,27].
In order to address the current gap of knowledge with regard to serum calcium-to-magnesium ratio in patients with apparently nonfunctional adrenal tumors, we aimed to analyze the ratio in menopausal women diagnosed with these tumors versus (tumor-free) controls, sub-analyzing the population based on Dual-Energy X-Ray Absorptiometry (DXA) categories of osteoporosis, osteopenia and normal.
This is a retrospective, real-world, cross-sectional study in menopausal women admitted at a single tertiary center of endocrinology (university hospital) with ethical approvals from hospital (number 37 from 09/22/2025) and associated university (number 7634 from 04/04/2025). We included women of 50 years or older who were in menopause (either surgical or physiological menopause) and who were diagnosed with non-functional adrenal tumors (adrenal incidentalomas) after their detection at abdominal computed tomography. We excluded patients with active (secretor) adrenal tumors (including Cushing’s syndrome), any type of endocrine dysfunction (e.g., hyperthyroidism, hypothyroidism, primary hyperparathyroidism), active/prior malignancies, renal, hepatic and bone metabolic disorders; prior medication against osteoporosis, insulin therapy, anti-obesity drugs, and corticotherapy.
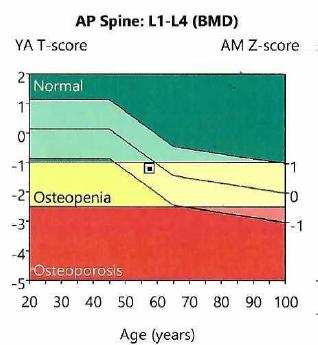
The subjects underwent central DXA (GE Lunar Prodigy device) and were grouped into osteoporosis, osteopenia, and normal DXA based on the lowest lumbar (L1-L4) T-score, according to the current World Health Organization (WHO) criteria for menopause [28-30]. The control group included patients with similar inclusion/exclusion criteria, except for the fact that they did not present any adrenal tumor at abdominal computed tomography scan.
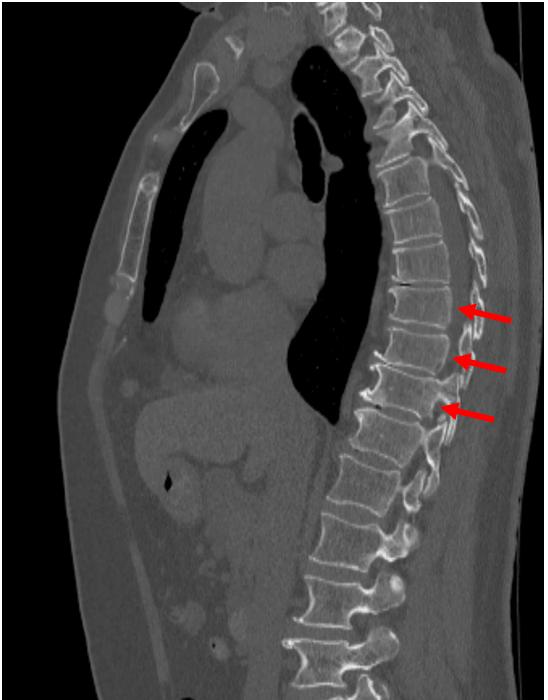
The collected data were: age, years since last menstruation, body mass index; baseline morning adrenocorticotropic hormone (ACTH) and plasma cortisol, as well cortisol levels after 1-mg overnight dexamethasone test (post-ODST) (which were of less than 5 µg/dL for the group with tumors and of less than the normal cutoff of 1.8 µg/dL for the control group); the largest diameter at computed tomography (tumor group); the prior/concurrent diagnosis of type 2 diabetes, arterial hypertension, dyslipidemia; biochemical parameters (fasting glycemia, glycated hemoglobin A1c, serum total calcium, magnesium, phosphorus); mineral metabolism-related hormones: 25-hydroxyvitamin D (25OHD) and PTH; DXA-based parameters (lumbar T-score and bone mineral density), thyroid profile [thyroid stimulating hormone (TSH) and free thyroxine (FT4)], and circulating bone turnover markers (osteocalcin, P1NP, total alkaline phosphatase, and CrossLaps). We calculated the serum total calcium-to-magnesium ratio, as well as the serum total calcium-to-phosphorus ratio, for the tumor group and the control group, respectively. Prevalent fragility (osteoporotic) fractures were registered from prior medical history/records, screening thoracic-lumbar spine X-ray, or opportunistic detection on abdominal computed tomography scans. Obesity, overweight, and normal weight were defined based on standard body mass index values [28].
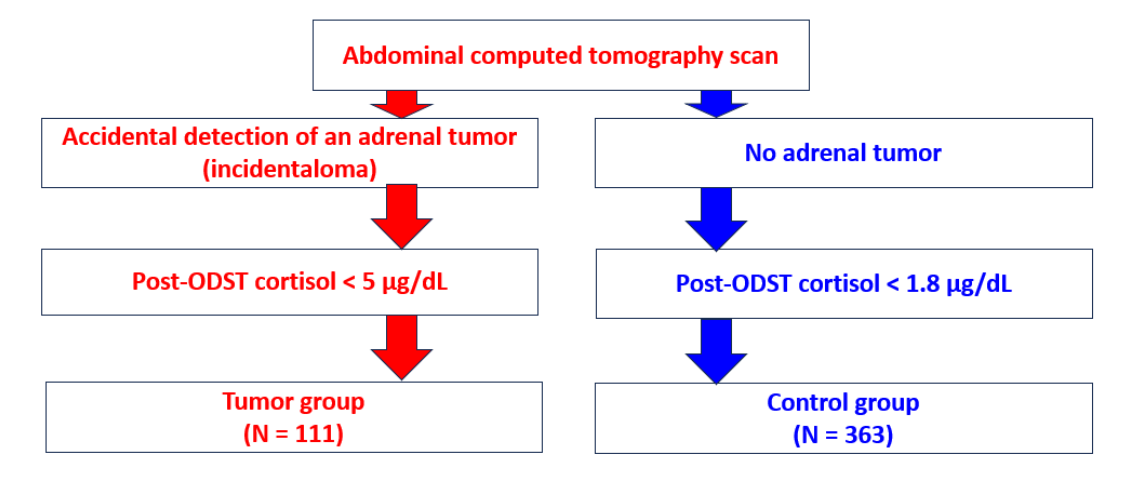
The parameters were introduced as mean ± standard deviation (in case of normal distribution); correlations between numerical variables were evaluated based on Spearman coefficient; student t-test was used to determine the statistical significance with a cutoff of < 0.05. (Figure 1)
We included 474 patients, 111 in the tumor group and 363 in (tumor-free) control group. Tumor group had 17.1% subjects with osteoporosis, 36.9% with osteopenia and 46% with normal DXA (a similar age and menopause duration was found between these three sub-groups). Body mass index was statistically significant higher in normal DXA versus osteoporosis sub-group (31.56 ± 5.60 versus 26.30 ± 4.59 kg/sqm, p = 0.011) and a higher prevalence of obesity was identified in normal DXA versus osteoporosis sub-group (60% versus 23%, p = 0.019), respectively, versus osteopenia sub-group (37%, p = 0.046).
Type 2 diabetes prevalence varied between 15% and 25% per (DXA-based) sub-group. While total serum calcium, magnesium and phosphorus were similar between DXA sub-groups, the calcium-to-phosphorus ratio was statistically significant lower in osteoporosis versus osteopenia (2.40 ± 0.39 versus 2.70 ± 0.46 mg/dL, p = 0.035), respectively, versus normal DXA sub-group (2.72 ± 0.36 mg/dL, p = 0.018), with similar calcium-to-magnesium ratio. Among the panel of bone turnover markers, osteocalcin was statistically significant higher in osteoporosis versus osteopenia sub-group (33.03 ± 13.45 versus 20.62 ± 8.29 ng/mL, p = 0.002), respectively CrossLaps (0.614 ± 0.23 versus 0.410 ± 0.16 ng/mL, p = 0.027), respectively, osteocalcin was higher in osteoporosis versus normal DXA sub-group (21.24 ± 10.78 ng/mL, p = 0.003). (Table 1)
| Parameter, unit | ||||||
|---|---|---|---|---|---|---|
| Number of patients (N, %) | 19, 17.1% | 41, 36.9% | 51, 46% | |||
| Age (years) (mean ± SD) | 59.78 ± 8.52 | 63.39 ± 8.06 | 62.21 ± 8.25 | 0.900 | 0.842 | 0.127 |
| Years since menopause (mean ± SD) | 12.66 ± 7.82 | 15.90 ± 8.35 | 12.80 ± 5.84 | 0.845 | 0.900 | 0.283 |
| Body mass index (kg/sqm) (mean ± SD) | 26.30 ± 4.59 | 28.68 ± 5.87 | 31.56 ± 5.60 | 0.572 | 0.011 | 0.068 |
| Obesity (N, %) | 3, 23% | 14, 37.8% | 27, 60% | 0.499 | 0.019 | 0.046 |
| Overweight (N, %) | 5, 38.5% | 11, 29.7% | 14, 31.1 % | 0.731 | 0.740 | 0.892 |
| Normal weight (N, %) | 5, 38.5% | 12, 32.4% | 4, 8.9% | 0.741 | 0.020 | 0.007 |
| Type 2 diabetes (N, %) | 3, 15.8% | 7, 17.5% | 12, 24% | 0.900 | 0.534 | 0.453 |
| Dyslipidaemia (N, %) | 13, 68.4% | 31, 77.5% | 45, 88.2% | 0.528 | 0.074 | 0.171 |
| Arterial hypertension (N, %) | 12, 63.2% | 32, 78% | 42, 82.4% | 0.225 | 0.114 | 0.605 |
| Fasting glycemia (mg/dL) (mean ± SD) | 99.00 ± 17.04 | 99.49 ± 12.27 | 105.31 ± 19.04 | 0.900 | 0.625 | 0.408 |
| Glycated haemoglobin A1c (%) (mean ± SD) | 5.61 ± 0.66 | 5.76 ± 0.42 | 6.01 ± 0.65 | 0.900 | 0.110 | 0.373 |
| Serum total calcium (mg/dL) (mean ± SD) | 9.33 ± 0.48 | 9.50 ± 0.41 | 9.58 ± 0.43 | 0.500 | 0.105 | 0.900 |
| Serum phosphorus (mg/dL) (mean ± SD) | 3.95 ± 0.55 | 3.60 ± 0.09 | 3.58 ± 0.45 | 0.058 | 0.034 | 0.900 |
| Serum magnesium (mg/dL) (mean ± SD) | 1.95 ± 0.23 | 1.98 ± 0.18 | 1.97 ± 0.21 | 0.900 | 0.900 | 0.990 |
| Calcium-to-magnesium ratio (mean ± SD) | 4.87 ± 0.83 | 4.83 ± 0.53 | 4.92 ± 0.65 | 0.990 | 0.900 | 0.900 |
| Calcium-to-phosphorus ratio (mean ± SD) | 2.40 ± 0.39 | 2.70 ± 0.46 | 2.72 ± 0.36 | 0.035 | 0.018 | 0.900 |
| PTH (pg/mL) (mean ± SD) | 49.32 ± 17.09 | 40.57 ± 16.20 | 44.65 ± 12.02 | 0.303 | 0.900 | 0.982 |
| 25OHD (ng/dL) (mean ± SD) | 25.23 ± 8.19 | 26.46 ± 10.73 | 22.11 ± 9.73 | 0.900 | 0.981 | 0.218 |
| P1NP (ng/mL) (mean ± SD) | 60.93 ± 10.19 | 53.60 ± 25.17 | 52.91 ± 22.85 | 0.990 | 0.800 | 0.800 |
| Alkaline phosphatase (U/L) (mean ± SD) | 84.11 ± 42.07 | 75.44 ± 24.46 | 80.13 ± 26.69 | 0.921 | 0.900 | 0.900 |
| Osteocalcin (ng/mL) (mean ± SD) | 33.03 ± 13.45 | 20.62 ± 8.29 | 21.24 ± 10.78 | 0.002 | 0.003 | 0.900 |
| CrossLaps (ng/mL) (mean ± SD) | 0.614 ± 0.23 | 0.410 ± 0.16 | 0.443 ± 0.26 | 0.027 | 0.069 | 0.900 |
| Lumbar (L1-4) bone mineral density | 0.813 ± 0.10 | 0.978 ± 0.05 | 1.183 ± 0.11 | <0.001 | <0.001 | <0.001 |
| Lumbar (L1-4) T-score | -3.13 ± 0.79 | -1.65 ± 0.37 | 0.12 ± 0.85 | <0.001 | <0.001 | <0.001 |
| Lumbar (L1-L4) Z-score | -1.95 ± 0.77 | -0.51 ± 0.57 | 0.74 ± 1.00 | <0.001 | <0.001 | <0.001 |
| Fragility fractures (N, %) | 3, 15.8% | 3, 7.3% | 5, 9.8% | 0.370 | 0.674 | 0.728 |
| ACTH (pg/mL) (mean ± SD) | 18.82 ± 17.87 | 15.96 ± 10.93 | 13.83 ± 8.97 | 0.800 | 0.457 | 0.700 |
| Plasma morning cortisol (µg/dL) (mean ± SD) | 13.77 ± 7.39 | 12.88 ± 5.18 | 13.66 ± 6.14 | 0.700 | 0.800 | 0.900 |
| Post-ODST cortisol (µg/dL) (mean ± SD) | 1.66 ± 0.78 | 1.84 ± 1.33 | 1.90 ± 1.26 | 0.880 | 0.900 | 0.880 |
| Bilateral tumours (N, %) | 4, 23.5% | 15, 38.5% | 18, 35.3% | 0.278 | 0.368 | 0.757 |
| Largest tumour diameter (cm) (mean ± SD) | 2.00 ± 0.70 | 2.29 ± 1.15 | 2.17 ± 0.84 | 0.990 | 0.900 | 0.800 |
| TSH (µUI/mL) (mean ± SD) | 1.63 ± 0.95 | 1.54 ± 1.02 | 2.02 ± 2.36 | 0.800 | 0.880 | 0.900 |
| FT4 (pmol/L) (mean ± SD) | 13.07 ± 3.61 | 14.06 ± 1.62 | 13.67 ± 2.46 | 0.530 | 0.800 | 0.700 |
Normal ranges for the blood parameters: ACTH: 3 – 66 pgmL; morning plasma cortisol: 6.2 – 19.4 µg/dL; post-ODST cortisol < 1.8 µg/dL; serum total calcium: 8.4 – 10.2 mg/dL; serum magnesium: 1.6 – 2.3 mg/dL; serum phosphorus: 2.3 – 4.7 mg/dL; PTH: 15 – 65 pg/mL; fasting glycemia: 70 – 105 mg/dL; glycated haemoglobin A1c: 4.8 – 5.9%; 25OHD: 30 – 100 ng/mL; P1NP: 20.25 – 76.31 ng/mL; osteocalcin: 15 – 46 ng/mL; total alkaline phosphatase: 35 – 104 U/L; CrossLaps: 0.33 – 0.782 ng/mL; TSH: 0.35 – 4.95 µUI/mL; FT4: 9 – 19 pmol/L . Normal T-score at central DXA > -1)
Control group (N = 363) included 13.8% patients with osteoporosis, 45.5% with osteopenia and 40.8% with normal DXA (no between-group difference was registered with respect to age and menopause duration). Body mass index was statistically significant different between each sub-group (the highest was in normal DXA sub-group). Obesity prevalence was statistically significant higher in normal DXA versus osteoporosis (50.4% versus 21.9%, p = 0.037), respectively, versus osteopenia (34.9%, p = 0.015). The mineral metabolism and adrenal parameters were similar between the three sub-groups, including calcium-to-magnesium and calcium-to-phosphorus ratios. (Table 2)
| Parameter, unit | ||||||
|---|---|---|---|---|---|---|
| Number of patients (N, %) | 50, 13.8% | 165, 45.5% | 148, 40.8% | |||
| Age (years) (mean ± SD) | 62.02 ± 8.13 | 61.89 ± 7.3 | 60.44 ± 7.91 | 0.900 | 0.625 | 0.286 |
| Years since menopause (mean ± SD) | 13.77 ± 8.01 | 12.90 ± 7.29 | 11.66 ± 8.30 | 0.700 | 0.500 | 0.695 |
| Body mass index (kg/sqm) (mean ± SD) | 25.42 ± 5.11 | 27.93 ± 4.70 | 30.00 ± 5.39 | 0.037 | <0.001 | 0.005 |
| Obesity (N, %) | 7, 21.9% | 44, 34.9% | 58, 50.4% | 0.159 | 0.004 | 0.015 |
| Overweight (N, %) | 9, 28.1% | 46, 36.5% | 36, 31.3% | 0.374 | 0.730 | 0.394 |
| Normal weight (N, %) | 16, 50% | 36, 28.6% | 21, 18.3% | 0.021 | <0.001 | 0.060 |
| Type 2 diabetes (N, %) | 7, 14.3% | 20, 12.1% | 33, 22.3 % | 0.689 | 0.227 | 0.017 |
| Dyslipidemia (N, %) | 30, 60% | 107, 65.2% | 101, 68.2% | 0.499 | 0.287 | 0.575 |
| Arterial hypertension (N, %) | 29, 58% | 94, 57% | 97, 65.5% | 0.897 | 0.338 | 0.121 |
| Fasting glycemia (mg/dL) (mean ± SD) | 100.79 ± 27.52 | 99.86 ± 19.44 | 104.64 ± 25.89 | 0.910 | 0.986 | 0.252 |
| Glycated haemoglobin A1c (%) (mean ± SD) | 5.65 ± 0.45 | 5.71 ± 0.55 | 5.89 ± 0.66 | 0.880 | 0.342 | 0.123 |
| Serum total calcium (mg/dL) (mean ± SD) | 9.41 ± 0.65 | 9.58 ± 0.42 | 9.52 ± 0.49 | 0.108 | 0.512 | 0.949 |
| Serum phosphorus (mg/dL) (mean ± SD) | 3.63 ± 0.57 | 3.56 ± 0.46 | 3.60 ± 0.53 | 0.900 | 0.800 | 0.870 |
| Serum magnesium (mg/dL) (mean ± SD) | 1.99 ± 0.18 | 2.03 ± 0.46 | 2.51 ± 0.61 | 0.990 | 0.943 | 0.913 |
| Calcium-to-magnesium ratio (mean ± SD) | 4.74 ± 0.48 | 4.82 ± 0.60 | 4.77 ± 0.82 | 0.899 | 0.777 | 0.800 |
| Calcium-to-phosphorus ratio (mean ± SD) | 2.66 ± 0.44 | 2.73 ± 0.39 | 2.71 ± 0.44 | 0.877 | 0.760 | 0.900 |
| PTH (pg/mL) (mean ± SD) | 43.71 ± 13.64 | 43.66 ± 11.65 | 44.71 ± 11.93 | 0.890 | 0.900 | 0.700 |
| 25OHD (ng/dL) (mean ± SD) | 21.59 ± 9.43 | 24.47 ± 9.53 | 23.28 ± 8.94 | 0.212 | 0.893 | 0.899 |
| P1NP (ng/mL) (mean ± SD) | 64.45 ± 23.25 | 60.08 ± 28.27 | 53.86 ± 22.08 | 0.920 | 0.181 | 0.309 |
| Alkaline phosphatase (U/L) (mean ± SD) | 76.27 ± 21.90 | 78.27 ± 30.01 | 76.72 ± 19.89 | 0.990 | 0.890 | 0.780 |
| Osteocalcin (ng/mL) (mean ± SD) | 25.76 ± 10.76 | 24.59 ± 9.36 | 22.74 ± 13.06 | 0.880 | 0.482 | 0.608 |
| CrossLaps (ng/mL) (mean ± SD) | 0.488 ± 0.18 | 0.529 ± 0.80 | 0.419 ± 0.21 | 0.900 | 0.990 | 0.429 |
| Lumbar (L1-4) bone mineral density | 0.808 ± 0.08 | 0.969 ± 0.08 | 1.186 ± 0.14 | <0.001 | <0.001 | <0.001 |
| Lumbar (L1-4) T-score | -3.05 ± 0.51 | -1.68 ± 0.38 | 0.06 ± 1.01 | <0.001 | <0.001 | <0.001 |
| Lumbar (L1-L4) Z-score | -1.72 ± 0.75 | -0.68 ± 0.64 | 0.61 ± 1.14 | <0.001 | <0.001 | <0.001 |
| Fragility fractures (N, %) | 10, 20.4% | 12, 7.3% | 3, 2% | 0.700 | 0.600 | 0.670 |
| ACTH (pg/mL) (mean ± SD) | 12.75 ± 4.67 | 15.29 ± 6.37 | 20.81 ± 7.15 | 0.670 | 0.084 | 0.112 |
| Plasma morning cortisol (µg/dL) (mean ± SD) | 12.35 ± 2.86 | 13.31 ± 5.08 | 11.55 ± 4.37 | 0.890 | 0.850 | 0.923 |
| Post-ODST cortisol (µg/dL) (mean ± SD) | 0.92 ± 0.07 | 0.77± 0.10 | 0.74 ± 0.07 | 0.473 | 0.256 | 0.880 |
| TSH (µUI/mL) (mean ± SD) | 2.61 ± 3.80 | 1.98 ± 2.73 | 2.75 ± 3.55 | 0.715 | 0.930 | 0.124 |
| FT4 (pmol/L) (mean ± SD) | 13.35 ± 3.21 | 13.89 ± 2.74 | 17.02 ± 31.45 | 0.870 | 0.911 | 0.625 |
Normal ranges for the blood parameters: ACTH: 3 – 66 pgmL; morning plasma cortisol: 6.2 – 19.4 µg/dL; post-ODST cortisol < 1.8 µg/dL; serum total calcium: 8.4 – 10.2 mg/dL; serum magnesium: 1.6 – 2.3 mg/dL; serum phosphorus: 2.3 – 4.7 mg/dL; PTH: 15 – 65 pg/mL; fasting glycemia: 70 – 105 mg/dL; glycated haemoglobin A1c: 4.8 – 5.9%; 25OHD: 30 – 100 ng/mL; P1NP: 20.25 – 76.31 ng/mL; osteocalcin: 15 – 46 ng/mL; total alkaline phosphatase: 35 – 104 U/L; CrossLaps: 0.33 – 0.782 ng/mL; TSH: 0.35 – 4.95 µUI/mL; FT4: 9 – 19 pmol/L . Normal T-score at central DXA > -1)
Calcium-to-phosphorus ratio was statistically significantly lower in osteoporotic patients from tumor group versus control group (2.40 ± 0.39 versus 2.66 ± 0.44 mg/dL, p = 0.036). (Table 3).
| Study group/sub-group | ||
|---|---|---|
| Osteoporosis Tumor group versus control group |
p-value = 0.426 | p-value = 0.036 |
| Osteopenia Tumor group versus control group |
p-value = 0.916 | p-value = 0.681 |
| Normal DXA Tumor group versus control group |
p-value = 0.248 | p-value = 0.872 |
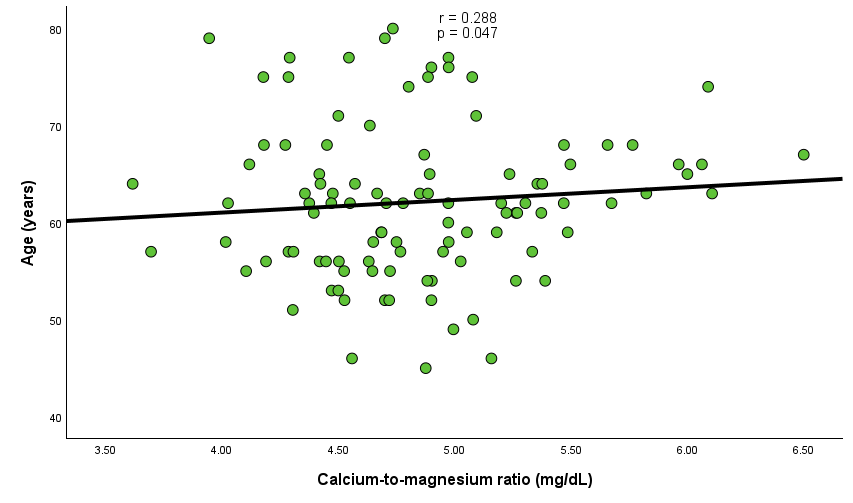
Calcium-to-magnesium ratio statistically significantly and positively corelated with the patients’ age in tumor group with normal DXA (N = 51, r = 0.288, p = 0.047) and negatively with bone formation markers P1NP (r = -0.459, p = 0.011), osteocalcin (r = -0.37, p = 0.026) and bone resorption marker CrossLaps (r = -0.446, p = 0.006). (Figure 2)
In patients with adrenal incidentalomas, calcium-to-magnesium ratio statistically significantly associated with glycated hemoglobin A1c level (%) only in osteoporotic group (N = 19, r = 0.596, p = 0.025). On the other hand, calcium-to-phosphorus ratio displayed statistically significant inverse correlation coefficients with body mass index (r = -0.426, p = 0.011), P1NP (r = -0.509, p = 0.026), osteocalcin (r = -0.435, p = 0.018) in osteopenia sub-group (N = 41). (Table 4)
| Calcium-to-magnesium ratio | Calcium-to-phosphorus ratio | |||||
|---|---|---|---|---|---|---|
| Parameter, unit, normal ranges | Osteoporosis | Osteopenia | Normal DXA | Osteoporosis | Osteopenia | Normal DXA |
| Age (years) | r = 0.041 p = 0.867 |
r = 0.039 p = 0.809 |
r = 0.288 p = 0.047 |
r = 0.340 p = 0.167 |
r = -0.250 p = 0.130 |
r = 0.140 p = 0.355 |
| Years since menopause | r = -0.012 p = 0.973 |
r = -0.069 p = 0.717 |
r = 0.136 p = 0.423 |
r = 0.462 p = 0.210 |
r = -0.296 p = 0.126 |
r = -0.048 p = 0.782 |
| Body mass index (kg/sqm) | r = 0.201 p = 0.511 |
r = 0.175 p = 0.300 |
r = 0.174 p = 0.252 |
r = 0.343 p = 0.275 |
r = -0.426 p = 0.011 |
r = -0.130 p = 0.411 |
| Fasting glycemia (mg/dL) | r = 0.372 p = 0.172 |
r = 0.281 p = 0.113 |
r = 0.079 p = 0.632 |
r = 0.277 p = 0.337 |
r = -0.159 p = 0.394 |
r = 0.176 p = 0.298 |
| Glycated hemoglobin A1c (%) | r = 0.596 p = 0.025 |
r = 0.069 p = 0.749 |
r = 0.282 p = 0.132 |
r = -0.143 p = 0.642 |
r = -0.191 p = 0.408 |
r = 0.106 p = 0.591 |
| PTH (pg/mL) | r = 0.098 p = 0.762 |
r = -0.407 p = 0.067 |
r = -0.210 p = 0.265 |
r = 0.100 p = 0.770 |
r = -0.230 p = 0.344 |
r = 0.315 p = 0.102 |
| 25OHD (ng/mL) | r = -0.253 p = 0.405 |
r = -0.030 p = 0.874 |
r = -0.274 p = 0.092 |
r = 0.154 p = 0.633 |
r = 0.332 p = 0.078 |
r = -0.113 p = 0.499 |
| P1NP (ng/mL) | r = -0.267 p = 0.488 |
r = -0.104 p = 0.670 |
r = -0.459 p = 0.011 |
r = -0.333 p = 0.420 |
r = -0.509 p = 0.026 |
r = -0.740 p = 0.698 |
| Alkaline phosphatase (U/L) | r = 0.027 p = 0.916 |
r = 0.006 p = 0.973 |
r = -0.053 p = 0.726 |
r = -0.416 p = 0.097 |
r = -0.018 p = 0.917 |
r = 0.206 p = 0.174 |
| Osteocalcin (ng/mL) | r = 0.063 p = 0.846 |
r = -0.253 p = 0.170 |
r = -0.370 p = 0.026 |
r = -0.400 p = 0.223 |
r = -0.435 p = 0.018 |
r = -0.080 p = 0.649 |
| CrossLaps (ng/mL) | r = -0.201 p = 0.510 |
r = -0.168 p = 0.376 |
r = -0.446 p = 0.006 |
r = 0.200 p = 0.533 |
r = -0.213 p = 0.276 |
r = -0.123 p = 0.483 |
| Lumbar (L1-4) bone mineral density | r = 0.368 p = 0.216 |
r = -0.124 p = 0.477 |
r = 0.211 p = 0.164 |
r = 0.578 p = 0.049 |
r = -0.003 p = 0.988 |
r = 0.028 p = 0.858 |
| Lumbar (L1-4) T-score | r = -0.089 p = 0.717 |
r = 0.057 p = 0.724 |
r = 0.076 p = 0.602 |
r = 0.483 p = 0.042 |
r = 0.065 p = 0.697 |
r = 0.064 p = 0.665 |
| Lumbar (L1-L4) Z-score | r = -0.252 p = 0.314 |
r = -0.123 p = 0.468 |
r = 0.237 p = 0.113 |
r = 0.216 p = 0.406 |
r = 0.235 p = 0.174 |
r = 0.163 p = 0.291 |
| ACTH (pg/mL) | r = -0.079 p = 0.781 |
r = 0.330 p = 0.065 |
r = 0.190 p = 0.228 |
r = 0.415 p = 0.124 |
r = -0.074 p = 0.701 |
r = 0.179 p = 0.269 |
| Plasma morning cortisol (µg/dL) | r = -0.036 p = 0.899 |
r = 0.152 p = 0.399 |
r = 0.104 p = 0.504 |
r = 0.273 p = 0.324 |
r = 0.010 p = 0.958 |
r = 0.062 p = 0.694 |
| Post-ODST cortisol (µg/dL) | r = 0.210 p = 0.513 |
r = 0.144 p = 0.535 |
r = 0.118 p = 0.500 |
r = -0.102 p = 0.753 |
r = -0.095 p = 0.708 |
r = 0.034 p = 0.848 |
| TSH (µUI/mL) | r = -0.111 p = 0.652 |
r = 0.086 p = 0.601 |
r = 0.087 p = 0.550 |
r = -0.197 p = 0.432 |
r = -0.086 p = 0.616 |
r = 0.058 p = 0.698 |
| FT4 (pmol/L) | r = 0.379 p = 0.147 |
r = -0.078 p = 0.647 |
r = -0.032 p = 0.850 |
r = -0.450 p = 0.092 |
r = 0.050 p = 0.777 |
r = 0.096 p = 0.566 |
In control group, osteopenic subjects (N = 165) showed a calcium-to-magnesium ratio positively and statistically significantly corelated with the subjects’ age (N = 165; r = 0.178, p = 0.034), fasting glycemia (r = 0.253, p = 0.003), glycated hemoglobin A1c (r = 0.22, p = 0.045), and negatively with osteocalcin (r = -0.196, p = 0.03), and CrossLaps, respectively (r = -0.193, p = 0.034). Calcium-to-phosphorus ratio also positively associated with fasting glycemia (r = 0.239, p = 0.004) and glycated hemoglobin A1c (r = 0.342, p = 0.001), as well as negatively with bone turnover markers: osteocalcin (r = -0.287, p = 0.001), alkaline phosphatase (r = -0.169, p = 0.047), and CrossLaps (r = -0.263, p = 0.003). In addition, the same sub-group (N = 165) showed a statistically significant correlation between this ratio and body mass index (r = 0.242, p = 0.012). Individuals with normal DXA (N = 148) were found to present a statistically significant, negative correlation between calcium-to-magnesium ratio and P1NP (r = -0.249, p = 0.027), respectively, between calcium-to- phosphorus ratio and CrossLaps (r = -0.271, p = 0.009). Osteoporotic tumor free patients showed a correlation between calcium-to-phosphorus ratio and PTH (N = 50; r = 0.473, p = 0.005). (Table 5)
| Calcium-to-magnesium ratio | Calcium-to-phosphorus ratio | |||||
|---|---|---|---|---|---|---|
| Parameter, unit, normal ranges | Osteoporosis | Osteopenia | Normal DXA | Osteoporosis | Osteopenia | Normal DXA |
| Age (years) | r = 0.136 p = 0.363 |
r = 0.178 p = 0.034 |
r = 0.085 p = 0.345 |
r = -0.112 p = 0.458 |
r = 0.152 p = 0.067 |
r = 0.049 p = 0.584 |
| Years since menopause | r = 0.079 p = 0.668 |
r = 0.166 p = 0.094 |
r = 0.036 p = 0.745 |
r = -0.159 p = 0.392 |
r = 0.060 p = 0.543 |
r = 0.099 p = 0.365 |
| Body mass index (kg/sqm) | r = -0.171 p = 0.366 |
r = 0.188 p = 0.054 |
r = -0.026 p = 0.803 |
r = 0.078 p = 0.694 |
r = 0.242 p = 0.012 |
r = 0.067 p = 0.526 |
| Fasting glycemia (mg/dL) | r = 0.065 p = 0.670 |
r = 0.253 p = 0.003 |
r = 0.168 p = 0.072 |
r = -0.004 p = 0.978 |
r = 0.239 p = 0.004 |
r = -0.012 p = 0.899 |
| Glycated haemoglobin A1c (%) | r = 0.141 p = 0.566 |
r = 0.220 p = 0.045 |
r = -0.098 p = 0.386 |
r = -0.159 p = 0.516 |
r = 0.342 p = 0.001 |
r = -0.100 p = 0.374 |
| PTH (pg/mL) | r = 0.145 p = 0.422 |
r = -0.019 p = 0.856 |
r = -0.198 p = 0.071 |
r = 0.473 p = 0.005 |
r = 0.119 p = 0.247 |
r = 0.159 p = 0.146 |
| 25OHD (ng/mL) | r = -0.017 p = 0.912 |
r = -0.074 p = 0.405 |
r = 0.026 p = 0.792 |
r = 0.245 p = 0.122 |
r = 0.059 p = 0.503 |
r = -0.063 p = 0.525 |
| P1NP (ng/mL) | r = -0.099 p = 0.631 |
r = -0.193 p = 0.082 |
r = -0.249 p = 0.027 |
r = -0.264 p = 0.202 |
r = -0.257 p = 0.021 |
r = -0.139 p = 0.239 |
| Alkaline phosphatase (U/L) | r = -0.188 p = 0.246 |
r = -0.047 p = 0.589 |
r = -0.175 p = 0.070 |
r = 0.169 p = 0.290 |
r = -0.169 p = 0.047 |
r = -0.237 p = 0.012 |
| Osteocalcin (ng/mL) | r = 0.082 p = 0.642 |
r = -0.196 p = 0.030 |
r = -0.147 p = 0.166 |
r = 0.077 p = 0.658 |
r = -0.287 p = 0.001 |
r = -0.180 p = 0.089 |
| CrossLaps (ng/mL) | r = 0.187 p = 0.268 |
r = -0.193 p = 0.034 |
r = -0.145 p = 0.166 |
r = 0.045 p = 0.790 |
r = -0.263 p = 0.003 |
r = -0.271 p = 0.009 |
| Lumbar (L1-4) bone mineral density | r = -0.015 p = 0.931 |
r = 0.036 p = 0.701 |
r = -0.047 p = 0.163 |
r = 0.126 p = 0.457 |
r = 0.008 p = 0.927 |
r = -0.175 p = 0.061 |
| Lumbar (L1-4) T-score | r = 0.140 p = 0.347 |
r = 0.035 p = 0.676 |
r = 0.004 p = 0.963 |
r = 0.210 p = 0.161 |
r = -0.014 p = 0.867 |
r = -0.159 p = 0.076 |
| Lumbar (L1-L4) Z-score | r = 0.183 p = 0.229 |
r = 0.031 p = 0.724 |
r = 0.030 p = 0.746 |
r = 0.054 p = 0.729 |
r = -0.035 p = 0.694 |
r = -0.122 p = 0.185 |
| ACTH (pg/mL) | r = 0.500 p = 0.391 |
r = -0.095 p = 0.748 |
r = 0.139 p = 0.701 |
r = 0.800 p = 0.104 |
r = -0.280 p = 0.354 |
r = 0.200 p = 0.555 |
| Plasma morning cortisol (µg/dL) | r = 0.029 p = 0.957 |
r = 0.119 p = 0.713 |
r = -0.139 p = 0.701 |
r = -0.400 p = 0.505 |
r = -0.343 p = 0.276 |
r = 0.491 p = 0.150 |
| Post-ODST cortisol (µg/dL) | r = -0.200 p = 0.998 |
r = -0.400 p = 0.900 |
r = -0.300 p = 0.890 |
r = -0.720 p = 0.789 |
r = -0.120 p = 0.897 |
r = -0.460 p = 0.895 |
| TSH (µUI/mL) | r = 0.194 p = 0.196 |
r = 0.011 p = 0.895 |
r = -0.072 p = 0.429 |
r = 0.157 p = 0.302 |
r = -0.084 p = 0.324 |
r = -0.042 p = 0.644 |
| FT4 (pmol/L) | r = -0.050 p = 0.752 |
r = 0.098 p = 0.271 |
r = 0.050 p = 0.597 |
r = -0.093 p = 0.570 |
r = 0.068 p = 0.448 |
r = -0.122 p = 0.199 |
In this study, we included 474 patients with adrenal incidentalomas (N = 111), who displayed a post-ODST cortisol less than 5 µg/dL, respectively, < 1.8 µg/dL in control group (N = 363). The cohort with tumors actually involved two sub-categories: those with a true non-functional profile (a post-ODST cortisol level less than 1.8 µg/dL) and those with a mild autonomous cortisol secretion (a post-ODST cortisol value between 1.8 and 5 µg/dL) [31,32]. (Figure 3A+B+C+D)
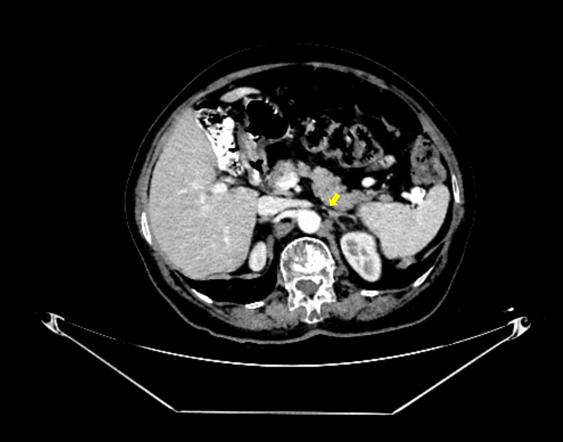
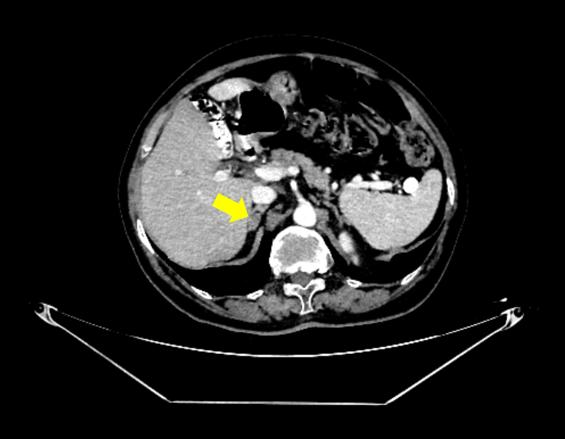
We enrolled them across the same cluster of analysis since, recently, alternative biomarkers of ACTH-cortisol axis exploration have been proposed to help the characterization of these tumors in addition to the cutoffs of post-ODST cortisol measurements [33-37]. For instance, adrenal androgens suppression, the combination of post-ODTS cortisol with baseline morning ACTH value, different assays of urinary and salivary cortisol, etc. suggested that post-ODST might not be a stand-alone marker of the hormonal profile in adults with adrenal cortex adenomas that were incidentally detected (in the absence of a fully manifested clinical picture of Cushing’s syndrome) [38-41]. Notably, we found no particular association between post-ODST or baseline cortisol and calcium-to-magnesium/calcium-to-phosphorus ratios, nor with morning plasma ACTH.
Calcium-to-magnesium ratio was similar between DXA sub-groups in each study group. In tumor group: the ratio corelated with age (r = 0.288, p = 0.047), P1NP (r = -0.459, p = 0.011), osteocalcin (r = -0.37, p = 0.026) and CrossLaps (r = -0.446, p = 0.006) in subjects with normal DXA (N = 51), while in osteoporotic females (N = 19), it associated with glycated hemoglobin A1c (r = 0.596, p = 0.025). In control group: the ratio corelated with age (r = 0.178, p = 0.034), fasting glycemia (r = 0.253, p= 0.003), glycated hemoglobin A1c (r = 0.22, p = 0.045), osteocalcin (r = -0.196, p = 0.03), and CrossLaps (r= -0.193, p = 0.034) in osteopenic subjects (N = 165), respectively, with P1NP (r = -0.249, p = 0.027) in normal DXA sub-group (N = 148).
Interestingly, we pointed out that the ratio gains a distinct significance depending on the DXA category, not in comparing between-group differences, but in the correlations with circulating bone markers. This aspect may be related to an abnormal level of calcium, magnesium or both, noting that patients with prior medication against osteoporosis were ruled out, but we could not quantify the calcium/magnesium intake via food and supplements, and this might come as a potential bias [42]. Of note, we found no correlation with bone mass at DXA, and some prior data suggested that calcium intake might be more important in this matter (not the circulating level), but not all authors agree [43].
The association between calcium-to-magnesium ratio and glycemia, respectively, glycated hemoglobin A1 (that was found in some sub-groups, not all) pinpoints its metabolic contribution irrespective of the DXA results, since a low magnesium and a higher calcium are prone to endothelial dysfunction, increased oxidative stress and impairment of insulin release and peripheral actions [44,45]. Whether the additional contribution of tumor-related cortisol represents a co-loop is still an open matter. For instance, Alsheikh et al. [18] analyzed the impact of serum calcium-to-magnesium ratio in adults diagnosed with metabolic syndrome. This was a cross-sectional analysis in 9693 residents from Qatar amid prior data collection at Qatar Biobank. 19% of the study population fulfilled the criteria of metabolic syndrome. Serum magnesium was statistically significant higher in the patients confirmed with the syndrome versus those who were syndrome-free (0.83 ± 0.06 mmol/L versus 0.81 ± 0.08 mmol/L, p < 0.05). On the contrary, the serum calcium-to-magnesium ratio was higher in the group with metabolic syndrome versus controls (2.30 ± 0.08 mmol/L, 2.77 ± 0.23 mmol/L, p < 0.05). An inverse association between magnesium quartiles and the presence of metabolic syndrome was found, as opposite to a positive dose-response with respect to calcium-to-magnesium ratio, respectively, serum total calcium and the diagnosis of the metabolic syndrome [18].
Other applications of the calcium-to-magnesium ratio involve the association with the risk of kidney stones in primary hyperparathyroidism, which was proposed as a novel biomarker under these specific circumstances (in addition to the traditional value of 24-hour urinary calcium). Yalçın et al. [20] studied 367 patients diagnosed with primary hyperparathyroidism, and receiver operating characteristics showed an optimal cutoff of 6.35, while multivariate regression proved the ratio to be an independent predictor of nephrolithiasis [20]. In addition, Kabaswa et al. [17] analyzed the calcium-to-magnesium ratio, not only according the studied population’s intake, but, also, in albuminuria, noting that both minerals homeostasis involves a normal kidney function [46-48]. This was a cross-sectional, community-based study in Japan (N = 6,849 patients of 40 years or older, with an average age of 68.8 years, and more than a half were women). A lower intake of both minerals was corelated with a log-transformed albumin-to-creatinine ratio, while, after adjustment, only calcium remained statistically significant. These findings suggested that magnesium should be cautiously interpreted depending on the calcium intake, and their ratio might become more relevant for practical purposes than individually analyzing each of them [17].
A second analysis involved the calcium-to-phosphorus ratio in menopausal females who, of note, were excluded if they presented traditional anomalies of the mineral metabolism. In the tumor group: the ratio was lower in osteoporosis versus osteopenia (N = 19, 2.40 ± 0.39 versus N = 41, 2.70 ± 0.46 mg/dL, p = 0.035), respectively, versus normal DXA sub-group (N = 51, 2.72 ± 0.36 mg/dL, p = 0.018). Only in osteopenia patients (N = 41) the ratio corelated with body mass index (r = -0.426, p = 0.011), P1NP (r = -0.509, p = 0.026), and osteocalcin (r = -0.435, p = 0.018).
In control group, osteopenic subjects (N = 165) had this ratio associated with body mass index (r = 0.242, p = 0.012), fasting glycemia (r = 0.239, p = 0.004), glycated hemoglobin A1c (r = 0.342, p = 0.001), osteocalcin (r = -0.287, p = 0.001), CrossLaps (r = -0.263, p = 0.003), alkaline phosphatase (r = -0.169, p = 0.047); in women with normal DXA (N = 148) the ratio correlated with CrossLaps (r = – 0.271, p = 0.009). Osteoporotic tumor-free patients showed a correlation between the ratio and PTH (N = 50; r = 0.473, p = 0.005). The ratio was decreased in osteoporotic females with tumors versus those who were osteoporotic, but tumor-free (N = 19, 2.40 ± 0.39 versus N = 50, 2.66 ± 0.44 mg/dL, p = 0.036). Notably, a lower phosphorus might involve an anomaly of vitamin D metabolism; however, in the present cohort, we found no correlations of the studied ratios with 25OHD. Also, PTH might increase calcium and decrease phosphorus, which potentially explains the association with the hormone. The calcium-to-phosphorus ratio might be more important in patients under hemodialysis or those with recurrent kidney stones [49-53].
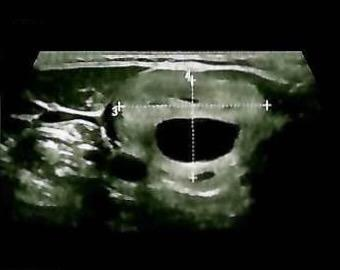
The limits of the current study involve the transversal design. An interesting analysis should expand the panel of metabolic issues that have been co-diagnosed in the patients with apparently non-functional adrenal tumours/mild autonomous cortisol secretion (e.g. criteria for metabolic syndrome). The distinction of the tumours with mild autonomous cortisol secretion (post-ODST cortisol between 1.8 and 5 µg/dL) potentially show a distinct profile with respect to calcium-to-magnesium ratio and further multiple regression models could reveal a multifactorial model, including imaging interplay [54-57]. Of note, this is a study in accidentally detected adrenal masses in patients who were evaluated amid an endocrine (clinical) setting and we did not provide an analysis of the primary endocrine condition on first admission such as goiter. (Figure 4)
Future inclusion of calcium, magnesium and phosphorus intake in the analysis of their blood levels may improve their practical approach, including the interpretation of the circulating levels. Bone-specific alkaline phosphatase potentially reflects more accurately the bone turnover rather than total alkaline phosphatase, an assay which is not available in our university hospital. In the light of a wider frame of assessments to characterize the adrenal profile, adrenal androgens, urinary free cortisol and midnight salivary cortisol assays might help, as well as urinary metabolomic analysis of the steroidogenesis-related markers [58-64].
In this study of 474 menopausal women, we pointed out that the calcium-to-magnesium ratio potentially gains distinct significance depending on the DXA sub-category in an exploratory analysis, not in comparing between-group differences, but in the correlations with circulating bone markers. The mentioned subgroup correlations remain exploratory at this point. Osteopenic (tumor-negative) and normal DXA (tumor-positive) subjects showed a direct association between the ratio and patients’ age, while the ratio was correlated with the bone turnover biomarkers distinctly across DXA subgroups. Additionally, the ratio might reflect a more severe glucose profile, as shown by glycated hemoglobin A1c. Notably, we found no particular association between baseline or post-ODST cortisol, nor ACTH and calcium-to-magnesium/calcium-to-phosphorus ratios. No direct correlation with bone mass at DXA was established. Osteoporotic tumor-free patients showed a positive correlation between the calcium-to-phosphorus ratio and PTH. This ratio was decreased in osteoporotic females with adrenal incidentalomas versus those who were osteoporotic, but tumor-free, which highlights potential influence of the adrenal-related status.
The authors declare no conflict of interest. This research received no external funding.
This is part of PhD research no. no. 27859 from 30 September 2024. This is a collaboration with the project “Biomarkers in endocrine tumours—limits of the clinical decision” (ethical approval no. 37 from 26 November 2024).
Conceptualization, M.-L.C., A.-I.T., A.D., A.-M.G., G.V., D.M., M.C., and L.S.; methodology, M.-L.C., A.-I.T., A.D., A.-M.G., G.V., D.M., M.C., and L.S.; software, M.-L.C., A.-I.T., and L.S.; validation, M.-L.C., A.-I.T., A.D., A.-M.G., M.C., and L.S.; formal analysis, M.-L.C., A.-I.T., A.D., A.-M.G., G.V., M.C., and L.S.; investigation, M.-L.C., A.-I.T., A.-M.G., G.V., D.M., M.C., and L.S.; resources, M.-L.C., A.-I.T., A.D., D.M., M.C., and L.S.; data curation, M.-L.C., A.-I.T., A.D., A.-M.G., G.V., D.M., M.C., and L.S.; writing—original draft preparation A.-I.T.; writing—review and editing, M.-L.C., A.-I.T., A.D., A.-M.G., M.C., and L.S.; visualization, M.-L.C.; supervision, M.-L.C.; project administration, M.-L.C.; funding acquisition, M.-L.C. All authors have read and agreed to the published version of the manuscript.
The Ethics Committee of Scientific Research of Carol Davila University of Medicine and Pharmacy, Bucharest, Romania, approved this study (No. 29336 from 17 October 2025) and C.I Parhon National Institute of Endocrinology, Bucharest, Romania (no. 37 from 26 November 2024).
Patient consent was waived due to retrospective design.