
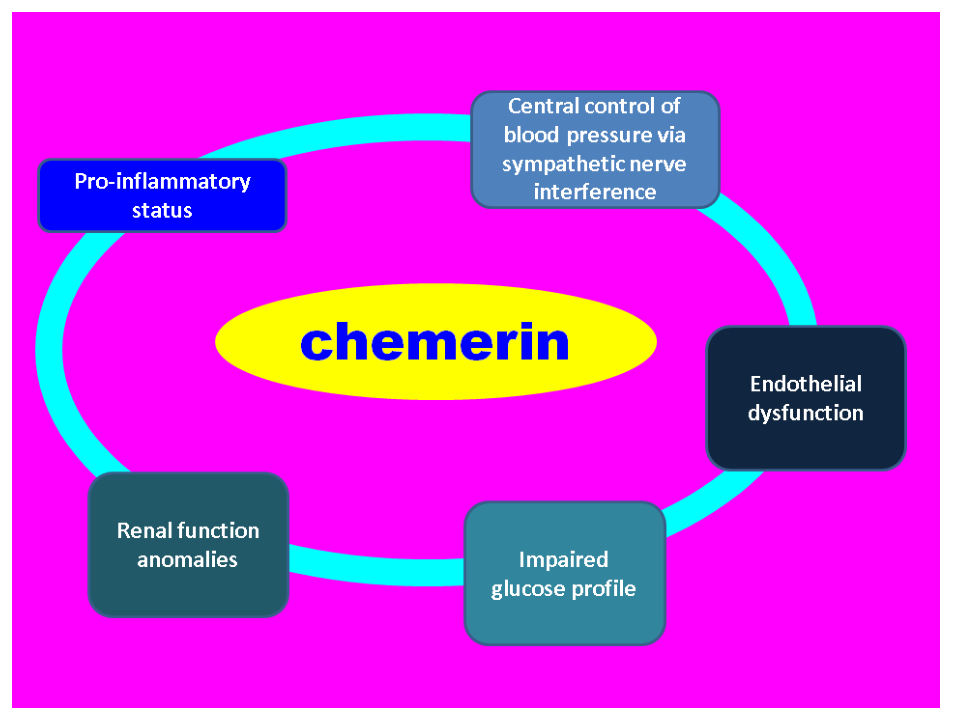
Chemerin represents a novel adipokine (fat tissue-released molecule), which was confirmed to play pivotal multifaceted roles in the intermediary metabolism loops regarding the cardio-metabolic, immune, and renal functions [1-3]. Chemerin receptor (designated as CMKLR1) is also expressed in the sympathetic nervous system (e.g., brain areas such as the nucleus tractus solitarii, paraventricular nucleus, etc.), which centrally regulates blood pressure [1,4-6]. The immune role involves leukocyte recruitment, endothelial function regulation, and stimulation of macrophage mobilization during the inflammation process. Of note, the endothelial connection of chemerin also interplays with blood pressure control and renal status across multi-layered crosstalk with other adipokines and myokines [1,7-9]. Currently, in patients living with chronic kidney disease, chemerin has been proposed as a useful biomarker of progressive renal function deterioration, noting that the molecule amplifies the local and systemic damage via pro-fibrotic, pro-inflammatory effects and lipotoxicity [10-12].
With regard to the glucose and lipid profile, chemerin promotes central and peripheral actions, for instance, adipocyte differentiation, as well as central appetite control [1,13-15]. (Figure 1)
Nowadays, new ailments are under research with respect to the chemerin-related impact in their associated cardio-metabolic dysfunction and inflammatory anomalies, for example, polycystic ovary syndrome [16], atrial fibrillation (which might associate with CMKLR1 dysregulation according to murine experiments) [17], sarcopenia/dynapenia (associated with a higher circulating chemerin in elderly) [18] or obstructive sleep apnea syndrome [19].
Currently, the global epidemiologic impact of obesity requires continuous seeking of practical biomarkers; hence, this current study aimed to address the gap of chemerin assays in obese versus non-obese females and to analyze its circulating levels in relationship with the glucose profile and other circulating adipokines.
This is an exploratory, prospective study in adults aged between 50 and 80 years with confirmed menopausal status. We only included the individuals who signed the informed consent according to the prospective study protocol. We excluded patients with previous or current confirmation/suspicion of diabetes, cancers, as well as endocrine, kidney, cardiovascular (hypertension, dyslipidemia), and bone (acute and chronic) conditions. Also, subjects with active infections during the study were ruled out. The patient’s exposure to exogenous estrogens as hormone replacement therapy, anti-obesity drugs, and prior bariatric surgery excluded the subjects, as well.
Apparently healthy consecutive menopausal females within the mentioned age ranges underwent screening for exclusion criteria, and then fasting assays (after a minimum of 8 and a maximum of 12 hours of overnight fasting) were performed. Patients with fasting glycemia less than 125 mg/dL further underwent 75-oral glucose tolerance test (OGTT) with hourly testing of blood glucose and insulin levels. The females with a glycemia value of 200 mg/dL or above two hours after oral glucose administration were also excluded (this is consistent with the diagnosis of type 2 diabetes mellitus). The obesity group included patients with a body mass index (BMI) of 30 kg/sqm or above, and the non-obesity group enrolled subjects with a BMI of less than 30 kg/sqm. (Figure 2)
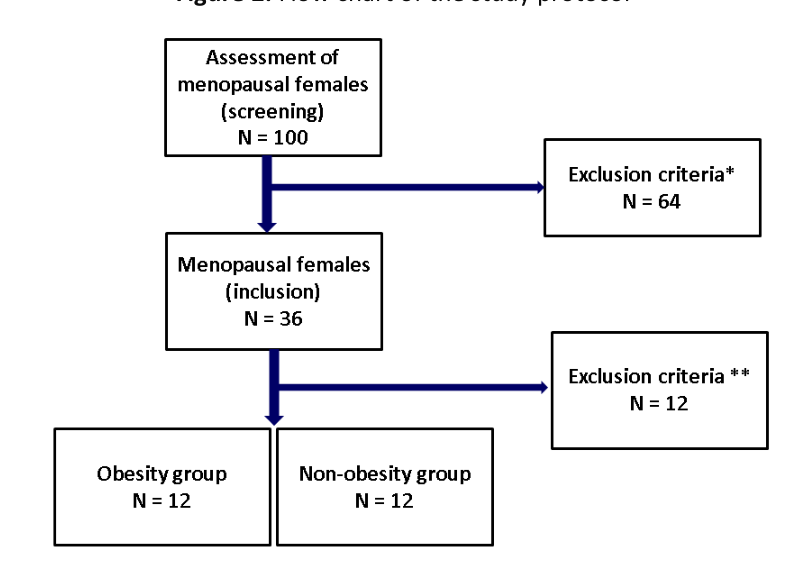
Abbreviations: N = number of patients; *exclusion criteria at screening level: diabetes; cancers; endocrine, kidney, cardiovascular (hypertension, dyslipidemia) and bone conditions; active infections; hormone replacement therapy at menopause, anti-obesity drugs, prior bariatric surgery; **exclusion criteria based on the glucose profile: fasting glycaemia > 125 mg/dL, and 2-hour glycaemia ≥ 200 mg/dL during oral glucose tolerance test)
ELISA (enzyme-linked immunosorbent assay)-based circulating adipokines testing was performed, according to the kit Quantibody® Human Obesity Array 3 (RayBiotech, Norcross, GA, USA; inter-assay precision < 20%) [20]. The final analysis was focused on circulating chemerin results (ng/mL) in obese versus non-obese groups and associated correlations with, on one hand, the parameters of glucose profile [glycaemia – photometry (Abbott, mg/dL); insulin – CLIA (Beckman Coulter, µUI/mL), glycated hemoglobin A1c – turbidimetry (Roche), HOMA-IR (Homeostatic Model Assessment of Insulin Resistance) based on formula fasting glycaemia (mg/dL) X fasting insulin (µUI/mL) per 405; a value > 2 means insulin resistance) and, on the other hand, tested molecules (adipokines). (Figure 3)
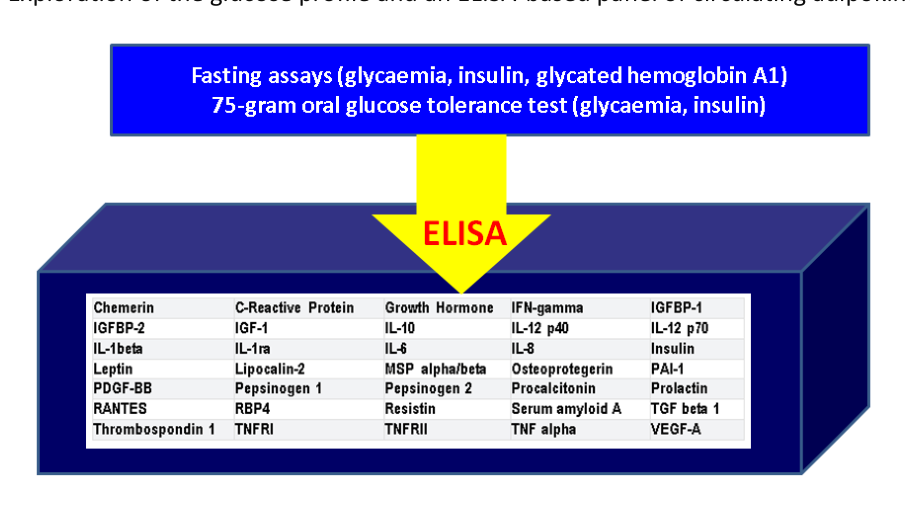
Abbreviations: IFN = interferon; IL = interleukin; IGF = insulin-like growth factor; IGFBP = insulin-like growth factor binding protein; MSP = macrophage stimulating protein; PAI = plasminogen activator inhibitor; PGDF-BB = platelet-derived growth factor; RANTES = acronym for Regulated upon Activation, Normal T-cell Expressed and Secreted; RBP = retinol binding protein; TGF = transforming growth factor; TNFR = tumor necrosis factor receptor; VEGF = vascular endothelial growth factor
MedCalc® Statistical Software version 23.3.7 was used to provide Kolmogorov-Smirnov analysis for normality. The t-test or the Mann-Whitney test was used for normal distribution or non-normal distribution. Pearson and Spearman rank correlations provided the correlation coefficients for the population with normal, respectively, non-normal distribution. A p-value below 0.05 was considered statistically significant.
Ethical aspects included the signed informed consent by each patient at the study’s enrolment. The research was conducted according to the Declaration of Helsinki. This exploratory analysis is part of an international study PN-IV-P8-8.3-ROMD-2023-0262 (ethical approval board was as follows: no. 32//09/30/2024 for “C.I. Parhon” National Institute of Endocrinology, Bucharest, Romania and no. 97//11/20/2025 for “Nicolae Testemitanu” University of Medicine and Pharmacy, Chisinau, Republic of Moldova). The blood adipokines testing was performed at “C.I. Parhon” National Institute of Endocrinology, Bucharest, Romania.
The exploratory analysis included the obesity group (N = 12), which was similar to the non-obesity group (N = 12) in terms of patients’ age and years since menopause. (Table 1)
| Parameter | Obesity group | Non-obesity group | p |
|---|---|---|---|
| Age (years), mean ± SD | 60.00 ± 7.15 | 53.88 ± 6.98 | 0.105 |
| Years since menopause, mean ± SD | 9.14 ± 6.04 | 9.88 ± 7.00 | 0.833 |
| Body mass index (kg/sqm), mean ± SD | 32.83 ± 1.47 | 23.61 ± 2.70 | < 0.001 |
Abbreviations: SD = standard deviation; HOMA-IR = Homeostatic Model Assessment of Insulin Resistance; bold font means statistical significance
The analysis of the glucose profile-related features showed a statistically significantly higher HOMA-IR in the obesity versus the non-obesity group (p = 0.04), with a mean value sustaining insulin resistance only in the obesity group (2.55 ± 1.16, insulin resistance at HOMA-IR > 2). (Table 2)
| Parameter, unit | Obesity group | Non-obesity group | p-value | ||
|---|---|---|---|---|---|
| mean (median) | SD (IQR) | mean (median) | SD (IQR) | ||
| Fasting glycemia, mg/dL | 104.22 | 6.73 | 97.48 | 9.87 | 0.060 |
| Glycated hemoglobin A1c, % | 5.79 | 0.46 | 5.69 | 0.51 | 0.610 |
| HOMA-IR | 2.55 | 1.16 | 1.44 | 1.20 | 0.040 |
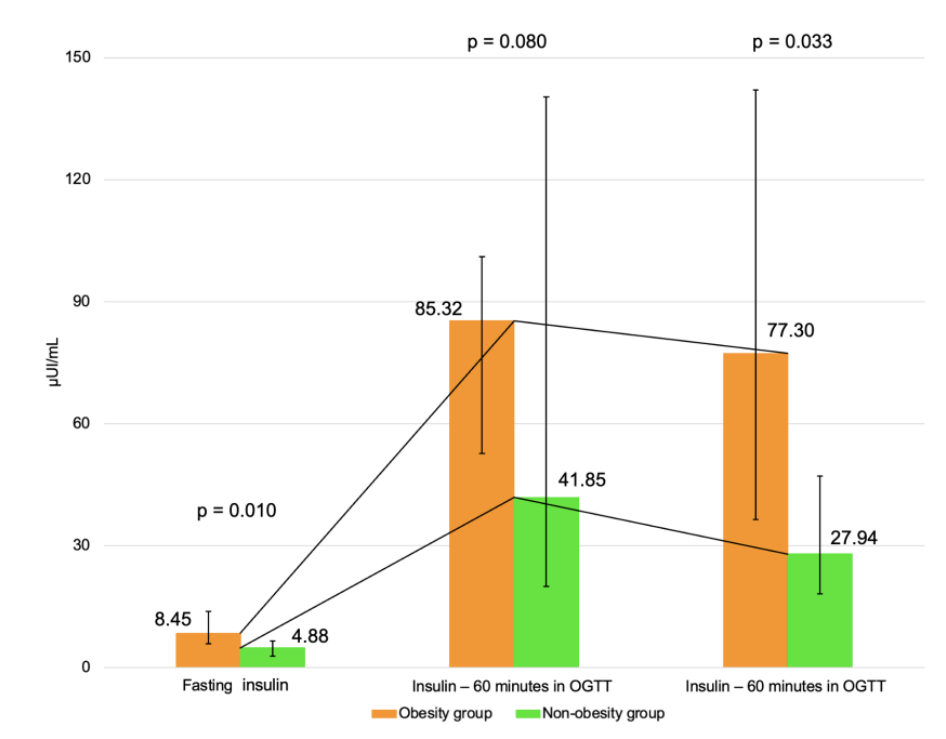
| Fasting insulin (µUI/mL) | 8.45 | 5.92, 13.86 | 4.88 | 2.77, 6.52 | 0.010 |
| Glycemia – at 1 hour in OGTT (mg/dL) | 186 | 173, 236 | 163 | 104, 228 | 0.201 |
| Glycemia – at 2 hours in OGTT (mg/dL) | 155 | 132, 170 | 112 | 89.65, 146.50 | 0.152 |
| Insulin – at 1 hour in OGTT (µUI/mL) | 85.32 | 52.71, 101.02 | 41.85 | 19.93, 140.32 | 0.080 |
| Insulin – at 2 hours in OGTT (µUI/mL) | 77.30 | 36.39, 142.00 | 27.94 | 18.08, 47.11 | 0.033 |
Abbreviations: HOMA-IR = Homeostatic Model Assessment of Insulin Resistance; IQR = interquartile range; OGTT = oral glucose tolerance test; SD = standard deviation; bold font means statistical significance
Insulin level was statistically significantly higher in the obesity group versus the non-obesity group, both at baseline (p = 0.01) and at two hours in OGTT (p = 0.033). (Figure 4)
Circulating chemerin level was similar between the two study groups. (Table 5)
| Parameter 1, unit | Obesity group | Non-obesity group | p-value | ||
|---|---|---|---|---|---|
| mean | SD | mean | SD | ||
| Chemerin, ng/mL | 40.36 | 15.95 | 20.85 | 7.95 | 0.89 |
| Leptin, ng/mL | 258.74 | 324.73 | 212.83 | 252.72 | 0.71 |
| IL-12 p40, ng/mL | 4.96 | 3.81 | 2.82 | 1.50 | 0.17 |
| VEGF-A, pg/mL | 117.64 | 105.26 | 204.07 | 131.83 | 0.17 |
Abbreviations: IL-12 p40 = interleukin-12p40; VEGF-A = vascular endothelial growth factor A; SD = standard deviation
| Parameter 1, unit | Parameter 2, unit | r (Obesity group) | p (Obesity group) | r (Non-obesity) | p (Non-obesity) |
|---|---|---|---|---|---|
| Chemerin, ng/mL | IL-12 p40, ng/mL | -0.829 | 0.0416 | -0.452 | 0.260 |
| Chemerin, ng/mL | Leptin, ng/mL | -0.713 | 0.0092 | -0.027 | 0.936 |
| Chemerin, ng/mL | VEGF-A, pg/mL | 0.857 | 0.0065 | -0.31 | 0.455 |
| Chemerin, ng/mL | Body mass index, kg/sqm | 0.881 | 0.0039 | -0.098 | 0.761 |
| Chemerin, ng/mL | Age, years | 0.308 | 0.330 | 0.400 | 0.600 |
| Chemerin, ng/mL | Fasting glycemia, mg/dL | -0.130 | 0.687 | 0.235 | 0.462 |
| Chemerin, ng/mL | Fasting insulin (µUI/mL) | 0.228 | 0.500 | -0.091 | 0.802 |
| Chemerin, ng/mL | Glycated hemoglobin A1c (%) | 0.357 | 0.255 | -0.336 | 0.288 |
| Chemerin, ng/mL | HOMA-IR | 0.256 | 0.450 | -0.091 | 0.802 |
| Chemerin, ng/mL | Glycemia – at 1 hour in OGTT (mg/dL) | 0.064 | 0.852 | -0.55 | 0.125 |
| Chemerin, ng/mL | Glycemia – at 2 hours in OGTT (mg/dL) | 0.287 | 0.392 | -0.333 | 0.380 |
| Chemerin, ng/mL | Insulin – at 1 hour in OGTT (mg/dL) | 0.999 | 0.988 | -0.6 | 0.087 |
| Chemerin, ng/mL | Insulin – at 2 hours in OGTT (mg/dL) | 0.009 | 0.978 | -0.405 | 0.319 |
| Leptin, ng/mL | Body mass index, kg/sqm | -0.112 | 0.729 | 0.779 | 0.004 |
| Leptin, ng/mL | Age, years | -0.179 | 0.577 | -0.400 | 0.600 |
| Leptin, ng/mL | Fasting glycemia, mg/dL | 0.238 | 0.900 | 0.879 | 0.123 |
| Leptin, ng/mL | Fasting insulin (µUI/mL) | -0.009 | 0.978 | 0.967 | 0.0001 |
| Leptin, ng/mL | Glycated hemoglobin A1c (%) | -0.189 | 0.556 | 0.191 | 0.573 |
| Leptin, ng/mL | HOMA-IR | -0.227 | 0.936 | 0.917 | 0.0005 |
| Leptin, ng/mL | Glycemia – at 1 hour in OGTT (mg/dL) | 0.127 | 0.709 | 0.170 | 0.700 |
| Leptin, ng/mL | Glycemia – at 2 hours in OGTT (mg/dL) | -0.433 | 0.183 | 0.167 | 0.693 |
| Leptin, ng/mL | Insulin – at 1 hour in OGTT (mg/dL) | 0.100 | 0.769 | 0.333 | 0.419 |
| Leptin, ng/mL | Insulin – at 2 hours in OGTT (mg/dL) | 0.055 | 0.873 | 0.071 | 0.400 |
| IL-12 p40, ng/mL | Body mass index, kg/sqm | -0.200 | 0.704 | -0.200 | 0.704 |
| IL-12 p40, ng/mL | Age, years | -0.257 | 0.622 | -0.257 | 0.622 |
| IL-12 p40, ng/mL | Fasting glycemia, mg/dL | 0.300 | 0.400 | 0.345 | 0.523 |
| IL-12 p40, ng/mL | Fasting insulin (µUI/mL) | 0.371 | 0.468 | 0.371 | 0.468 |
| IL-12 p40, ng/mL | Glycated hemoglobin A1c (%) | -0.086 | 0.877 | -0.086 | 0.871 |
| IL-12 p40, ng/mL | HOMA-IR | 0.371 | 0.468 | 0.371 | 0.468 |
| IL-12 p40, ng/mL | Glycemia – at 1 hour in OGTT (mg/dL) | 0.543 | 0.265 | 0.543 | 0.265 |
| IL-12 p40, ng/mL | Glycemia – at 2 hours in OGTT (mg/dL) | -0.143 | 0.787 | -0.143 | 0.787 |
| IL-12 p40, ng/mL | Insulin – at 1 hour in OGTT (mg/dL) | 0.486 | 0.328 | 0.486 | 0.328 |
| IL-12 p40, ng/mL | Insulin – at 2 hours in OGTT (mg/dL) | 0.314 | 0.544 | 0.324 | 0.544 |
| VEGF-A, pg/mL | Body mass index, kg/sqm | -0.048 | 0.910 | -0.048 | 0.910 |
| VEGF-A, pg/mL | Age, years | 0.335 | 0.416 | 0.335 | 0.416 |
| VEGF-A, pg/mL | Fasting glycemia, mg/dL | 0.482 | 0.672 | 0.459 | 0.472 |
| VEGF-A, pg/mL | Fasting insulin (µUI/mL) | 0.179 | 0.701 | 0.179 | 0.701 |
| VEGF-A, pg/mL | Glycated hemoglobin A1c (%) | 0.571 | 0.139 | 0.571 | 0.139 |
| VEGF-A, pg/mL | HOMA-IR | 0.180 | 0.700 | 0.178 | 0.703 |
| VEGF-A, pg/mL | Glycemia – at 1 hour in OGTT (mg/dL) | 0.036 | 0.939 | 0.036 | 0.939 |
| VEGF-A, pg/mL | Glycemia – at 2 hours in OGTT (mg/dL) | 0.324 | 0.477 | 0.324 | 0.477 |
| VEGF-A, pg/mL | Insulin – at 1 hour in OGTT (mg/dL) | -0.357 | 0.431 | -0.357 | 0.431 |
| VEGF-A, pg/mL | Insulin – at 2 hours in OGTT (mg/dL) | 0.040 | 0.900 | 0.036 | 0.939 |
Abbreviations: IL-12 p40 = interleukin-12p40; r = correlation coefficient; OGTT = oral glucose tolerance test; VEGF-A = vascular endothelial growth factor A; bold font means statistical significance
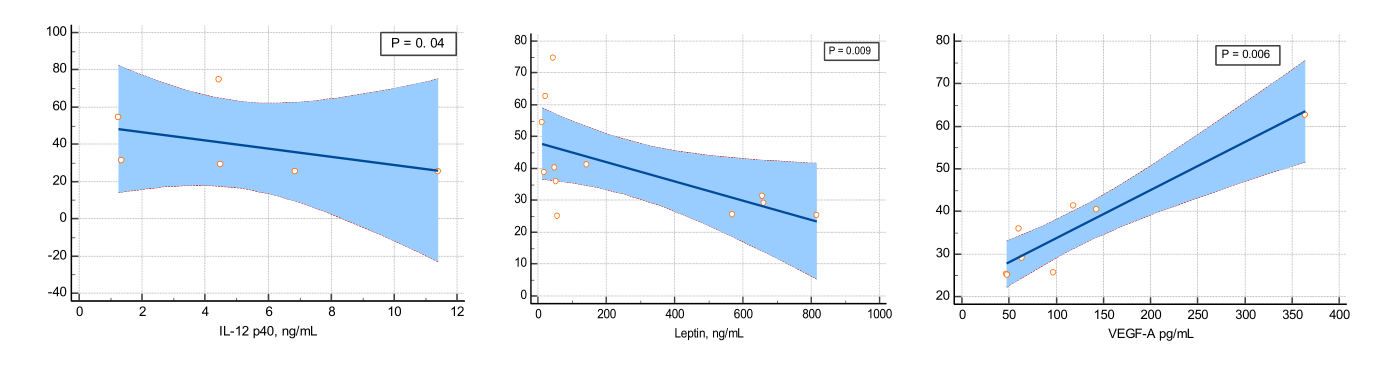
Among the previously mentioned adipokines, chemerin was statistically significantly correlated with leptin, IL-12 p40, and VEGF-A only in the obesity group. In the non-obesity group, chemerin did not correlate with any of these adipokines. (Table 6)
The blood chemerin value showed a statistically significant positive, strong correlation with VEGF-A level (r = 0.857, p = 0.0065) and an inverse statistically significant strong association with circulating leptin (r = -0.713, p = 0.0092) and circulating IL-12 p40 (r = -0.829, p = 0.0416) in the female group with a higher BMI. (Figure 5)
In this exploratory analysis of obese versus age- and menopause duration-matched non-obese (diabetes-free) females in menopause, we found that circulating chemerin levels are similar, but the spectrum of correlations involving the other microarray-based adipokines is differently displayed between the groups. This suggests a multifactorial interplay depending on the BMI category. In addition, chemerin was found to be strongly correlated with BMI in obese women (r = 0.881, p = 0.0039), while leptin correlated with BMI in the non-obese group (r = 0.779, p = 0.004), which implies their interpretation should be dependent on the presence of obesity or not. Moreover, chemerin did not associate with glucose profile-related parameters, as opposed to other adipokines; for instance, we mention the positive correlation between leptin and fasting insulin (r = 0.967, p = 0.0001), respectively, HOMA-IR (r = 0.917, p = 0.0005) in the group with an average BMI within the normal BMI category (23.61 ± 2.70 kg/sqm).
These findings should be cautiously interpreted as the first step amid a more complex approach that is expected to take into consideration a multifactorial landscape combining the clinical features (e.g. weight, body fat percent, lean mass, BMI, menopausal status), biochemistry tests (e.g. glycaemia, insulin, HOMA-IR, glycated haemoglobin A1c, lipid profile), as well as the circulating levels of adipokines ± myokines that play synergic or antagonist roles in the intermediary metabolisms [21]. Further on, refining the multilayered panel of adipokines/myokines will pinpoint the patients with a high-risk of cardio-metabolic, osseous, neurologic, and oncologic outcomes; hence, a stratified multidisciplinary intervention strategy will provide an optimum prognosis [22-24]. At this point, as a potential hypothesis-generating analysis, we can only observe different statistical results in BMI-based groups, despite the fact that direct comparison of circulating chemerin and even leptin, VEGF-A, and IL-12 p40 did not reach between-group statistical significance. To date, prior studies addressing this type of topic in clinical practice have provided heterogeneous results to this moment. Yet, looking for novel biomarkers in the vast area of obesity and related overall health burden is emergent in the modern society due to its increasing incidence in the general population, on one hand, and, on the other hand, due to the novel anti-obesity agents (such as glucagon-like pepetide-1 receptor agonists) that are meant to correct even subclinical anomalies, which impact the long-term impact [25-27].
We mention some previously published data in order to integrate the current study, but the overall results remain a matter of debate. For instance, Yilmaz et al. [25] studied 74 obese, type 2 diabetic patients versus 60 non-obese, type 2 diabetic individuals versus 36 healthy controls and found that ELISA-based chemerin was similar between the three groups [25]. As identified in our study, this exploratory analysis also raised the issue of the diagnostic performance we currently have for testing chemerin in humans. On the contrary, Schinzari et al. [26] found that chemerin is higher in obese versus lean subjects, and it correlates with endothelial system-mediated vasoconstriction [26]. Moreover, a recent meta-analysis highlighted that chemerin is elevated in gestational diabetics versus normoglycemic controls (p = 0.02) [28], suggesting its importance in other population subgroups. In addition, Zhao et al. [29] showed in 42 patients with dyslipidemia who were (lipid–lowering) treatment-naïve a statistically significant correlation between chemerin and the level of circulating triglycerides (r2 = 0.5073, p < 0.0001), respectively, triglycerides (r2 = 0.1464, p = 0.0124) [29], an aspect which was out of our scope, but it might represent a future direction. Other data identified an association between chemerin and coronary slow flow in patients who underwent coronary angiography [30].
As the limits of the current study, we mention the sample size and the transversal design, which remain adequate for a pilot, exploratory analysis. Based on the adipokines’ results, further enrollment of the patients and a larger and more diverse study population will confirm a distinct interpretation of the correlations between adipokines in the obese population when compared to those with a BMI lower than 30 kg/sqm. Moreover, larger BMI sub-groups will pinpoint if there is a difference between the normal and overweight individuals. Despite the inclusion of diabetes-, hypertension-, and dyslipidemia-free individuals, chemerin seems to be correlated with central and peripheral underlying mechanisms in these conditions (directly or indirectly, for instance, via chronic inflammation), and future trials will clarify its importance as a biomarker under these pathological circumstances [31]. Currently, there is no standardized kit to test chemerin in everyday practice, and testing variability might generate a bias. Moreover, the relationship between the circulating level and its receptor activity should be taken into account, and it remains an open matter so far. Of note, some authors suggested a dietary influence on chemerin levels, an aspect which was not quantified in this analysis [32].
As a potential hypothesis-generating analysis, this pilot analysis showed different statistical results in BMI-based groups, despite the fact that direct comparison of circulating chemerin, and even leptin, VEGF-A, and IL-12 p40 did not reach between-group statistical significance.
The authors declare no conflict of interest. This work was supported by a grant of the Ministry of Research, Innovation and Digitization, UEFISCDI “Crossroad of metabolism and bone: the impact of irisin, bone turnover and inflammatory markers in patients with menopausal osteoporosis and obesity“; PN-IV-P8-8.3-ROMD-2023-0262.
This is part of the project PN-IV-P8-8.3-ROMD-2023-0262, in addition to collaboration with the PhD research according to the following theme: “Non-invasive techniques for identification of osteoporotic fracture risk in menopause” (contract number 28086 from 9 September 2024). No generative AI was used in the writing of this article.
Conceptualization, S.V.S, and D.M.; methodology, O.-C.S., M.K., and A.-M.G.; software, A.V., and E.M.P.; validation, A.C., Y.Y.; formal analysis, M.-L.C.; investigation, A.P.; resources, S.V.S.; data curation, D.M.; writing—original draft preparation, D.M., and M.C.; writing—review and editing, M.C.; visualization, S.V.S., E.M.P., A.C.; supervision, A.P, and A.V.; project administration, S.V.S.; funding acquisition, M.C. All authors have read and agreed to the published version of the manuscript.
The research was conducted in accordance with the Declaration of Helsinki. The study was approved by the Ethical Boards of both centers (number 32 from 30 September 2024 – Bucharest, Romania, respectively, number 97 from 20 November 2024 – Chisinau, Republic of Moldova).
Informed consent was obtained from all subjects involved in the study