
Quality of care (QoC) became a major challenge during the COVID-19 pandemic, especially once the World Health Organization classified it as a Public Health Emergency of International Concern (PHEIC)[1], creating disruptions in healthcare systems around the world. By definition, a PHEIC indicates a situation that poses a threat to public health, exceeds the borders of a single country, requiring global mobilization to prevent the spread and to provide assistance to affected countries. The declaration also helps in mobilizing international resources and preparing for a response[2].
During a PHEIC, like the COVID-19 pandemic, healthcare systems can become overwhelmed by large numbers of patients, especially when a large number of individuals need urgent medical care at the same time[3]. This can lead to shortages in hospital beds, medical equipment, and staff, ultimately affecting the quality of care provided (QoC). As COVID-19 affects multiple organ systems and represents a disruption of the daily care across all specialties, QoC is best analyzed across the entire hospital, rather than by department.
The COVID-19 pandemic has persistently affected healthcare services and the way hospitals delivered daily care changed due to overwhelmed healthcare systems [4], which led to changes in modes of care delivery [5], reorganization of hospital operations[6], staff shortages and burnout [7], delayed care and treatment[8] and supply chain disruptions[9], elements that would affect QoC.
Quality of healthcare (QoC) is an abstract concept, which makes it difficult to measure directly. There is no universal definition of healthcare quality, as different institutions and individuals may interpret it in various ways [10].
According to the WHO, the definition of QoC highlights the importance of healthcare services achieving positive health outcomes, addressing patients’ needs and preferences, and being delivered in a safe and equitable way. It also emphasizes the efficiency of resource use, reducing delays, and ensuring that services are accessible to everyone, regardless of their background or situation. In addition to defining quality of care as effective and safe, the WHO also emphasizes the importance of the patient’s perspective, defining it as people-centered[11]. The Institute of Medicine (IOM) defines healthcare quality as safe, effective, timely, patient-centered, efficient, and equitable[12]. Even though QoC is a theoretical idea, IOM defined the terms that compose the concept and provided a framework for measuring the items[13]. These attributes of QoC form the base of the measurable key performance indicators (KPI), widely used nowadays for evaluation of the healthcare performance. These indicators include patient access, inpatient and outpatient utilization, operating room utilization, ER utilization, generic utilization, patient safety, infection control, documentation, and patient satisfaction indicators reflecting patient-centeredness[14].
Starting from the QoC definition provided by literature, the main aim of our study is to evaluate QoC during the COVID-19 pandemic (March 2020 to May 2023)[15], in a military, emergency, and university hospital. A complementary objective is to benchmark “Dr. Carol Davila” Central Military Emergency University Hospital against an ideal, surge-ready hospital model, using a structured comparison (e.g., Composite Risk Index, flow reliability, triage capabilities) to identify system-level gaps that most influence patient-facing outcomes.
The secondary aim is to translate these findings, including the comparison between ideal and actual performance, into a pragmatic preparedness blueprint for future health emergencies, by refining clinical and operational protocols, shortening response times, targeting workforce training and surge staffing, and prioritizing investments (e.g., digital triage, discharge reliability, ambulatory capacity) that are most likely to improve both QoC and resilience.
The patient collection center was the “Dr. Carol Davila” Central Military Emergency University Hospital in Bucharest from 2020 to the first semester of 2023.
Inclusion criteria: adults (>18 years) hospitalized in any medical department of the “Dr. Carol Davila” Central Military Emergency University Hospital, Bucharest, receiving any type of care.
Exclusion criteria: patients who were unconscious or lacked decision-making capacity. According to the American Medical Association, Code of Medical Ethics Opinion 2.1.2: Decisions for Adult Patients Who Lack Capacity, 2016, decision-making capacity is the ability of a patient to understand relevant information, appreciate the medical consequences of their situation and choices, reason about treatment options, and communicate a consistent choice.
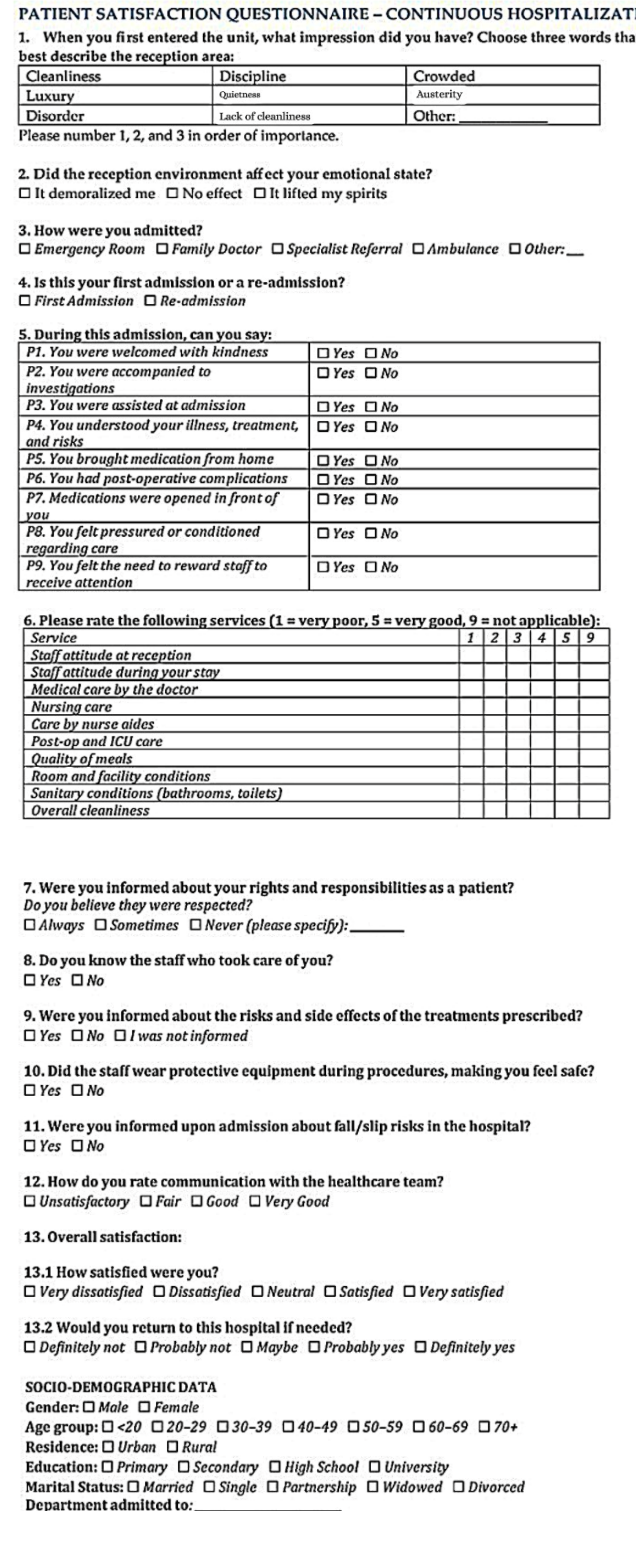
Data collection included information about first impression when entering the unit (cleanliness, discipline, luxury, quietness, austerity, disorder, lack of cleanliness), emotional impact when entering the unit (demoralized, no effect, uplifted), the modality of admission (ER, family doctor, specialist, ambulance, other), the recurrence of admission (first admission or a re-admission), about patient experience (reception with kindness, accompaniment to investigations, assistance during admission, understanding of illness, treatment, and associated risks, provision of personal medication, occurrence of post-operative complications, on-site opening of medication in patient’s presence, perception of pressure or coercion related to care, perceived necessity to reward staff). Data were also collected on service ratings, including staff attitude at reception, staff attitude during stay, medical care by doctor, nursing care, care by aides, post-op and ICU care, quality of meals, room facility conditions, sanitary conditions (bathrooms, toilets), overall cleanliness and data about information and safety (information about rights and responsibilities, knowing the staff who cared for them, information about treatment risks and side effects, about the use of protective equipment by the staff, and if they were informed about fall risks). Communication with the staff, overall satisfaction (general satisfaction, willingness to return, and recommendation of the hospital), and socio-demographic data were also collected.
Data collection instrument: “Patient Satisfaction Questionnaire- Continuous Hospitalization” approved by the quality officer in the “Dr. Carol Davila” Central Military Emergency University Hospital, Bucharest. The questionnaire was divided into two sections, the first included the patient’s perspective about the quality of the services (structured in 13 questions, with one or multiple answers), and the second part collected socio-demographic data.
Data analysis: Descriptive statistics were used to describe the study population and response distributions.
Patients were questioned at the end of the hospitalization process, after all types of continuous care. Participants received a written questionnaire in Romanian. The questionnaires were anonymous. They were subsequently placed by patients, relatives, or medical staff in a designated box, located in each medical ward, and were collected at the end of each month by designated staff.
The indicators used in analyzing quality of care from the patient’s perspective were the first impression of the patient characterized by descriptive words, the patient’s opinion about the services, using a grading from 1-5 (1 meaning very poor and 5 meaning very good), and overall satisfaction of the patient, ranging from very dissatisfied to very satisfied. Pearson correlation analysis was employed to assess the relationship between pairs of variables, utilizing the covariance approach. This method is considered one of the most reliable for evaluating associations between variables of interest.
A significance threshold of 0.01 was applied to all Pearson correlation tests. The strength of correlations was categorized as follows: strong (r > 0.700), moderate (r = 0.300-0.700), and weak (r < 0.300). We benchmarked "Dr. Carol Davila" Central Military Emergency University Hospital against an ideal, surge-ready hospital model to identify system-level gaps that most influence patient experience and safety during pandemics.
Using fractal theory and nonlinear dynamical systems, we modeled patient safety and hospital workflow as a complex adaptive system. To compare the mathematical model of an ideal hospital with the real situation at the “Dr. Carol Davila” Central Military Emergency University Hospital, we extracted relevant information from documents. Data analysis was conducted using IBM SPSS Statistics, version 25.0.
The study participants consisted of 10349 patients hospitalized in continuous care, spanning from 2020 through the first half of 2023, of whom 5143 were males (49,70%), and 5206 were females (50.30%). Ages ranged from 18 to 93 years, with a mean of 50,83 years. Patients came from 62.23% urban and 37.76% rural areas; 32,17% of them had higher education, while 67,83% had lower and middle education.
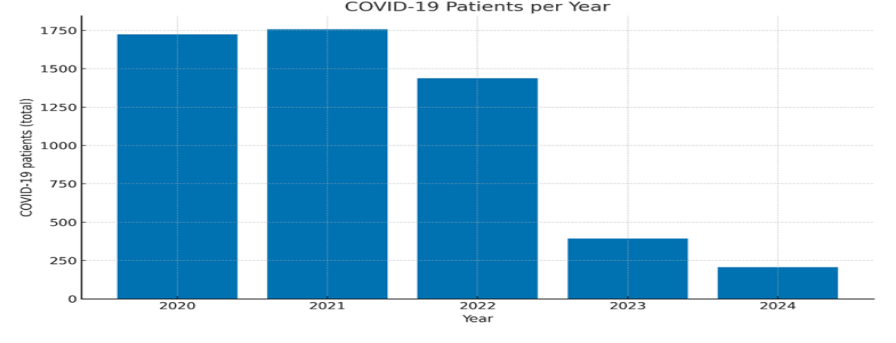
A marked decrease in annual COVID-19 admissions was observed at the Central Military Emergency University Hospital “Dr. Carol Davila” from 2020 to 2024. In 2020 and 2021, the hospital managed over 1,700 COVID-19 cases annually, reflecting the peak of the pandemic and the hospital’s critical role in care delivery. Admissions dropped to around 1,450 in 2022, coinciding with expanded vaccination and improved public health measures. By 2023 and 2024, annual admissions fell to fewer than 400 and 200 cases (Figure 2).
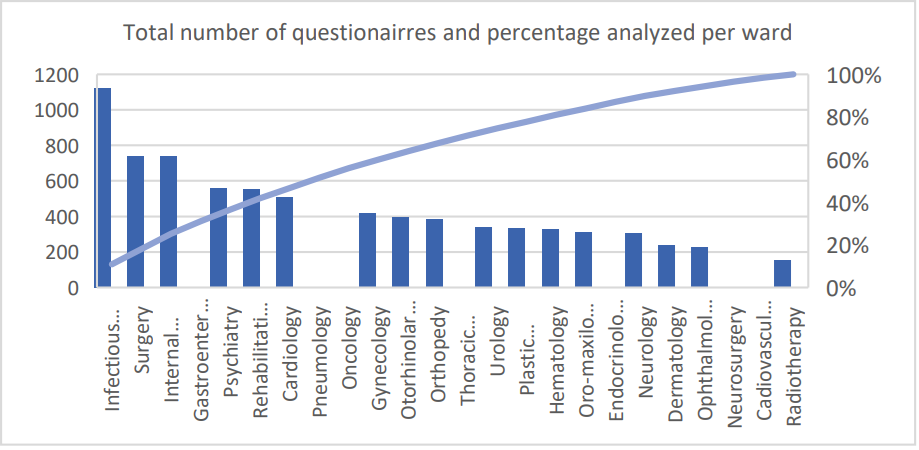
Most patients received continuous care in the Infectious Diseases ward, significantly more than in any other department, and the ones who completed the least the Satisfaction Questionnaire were hospitalized in the Radiotherapy ward. Along with Infectious diseases, Surgery, Internal medicine, Gastroenterology, Psychiatry and Rehabilitation were characterized by a high percentage of completed questionnaires (Figure 3). Regarding the distribution per semester, most questionnaires were completed in the Infectious diseases ward between 2020 and 2022. In the first semester of 2023, Gastroenterology was the compartment with the most analyzed patients.
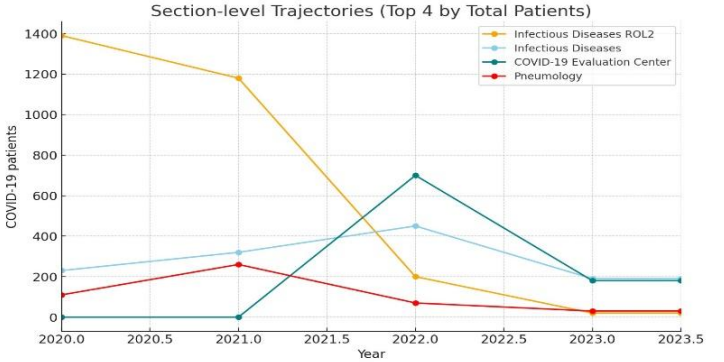
The yearly number of COVID-19 patients treated in the top 8 hospital sections at Emergency Military Hospital “Dr. Carol Davila” with the highest total case volumes during 2020-2024 were Infectious diseases ROL2, Infectious diseases, COVID-19 Evaluation Center and Pneumology. The “Infectious diseases ROL 2” were managed the majority of cases in the early pandemic, peaking at nearly 1,400 patients in 2020 and remaining the main COVID-19 section in 2021. However, admissions plummeted after 2021, reflecting both the centralization and then the redistribution of care as the pandemic evolved.
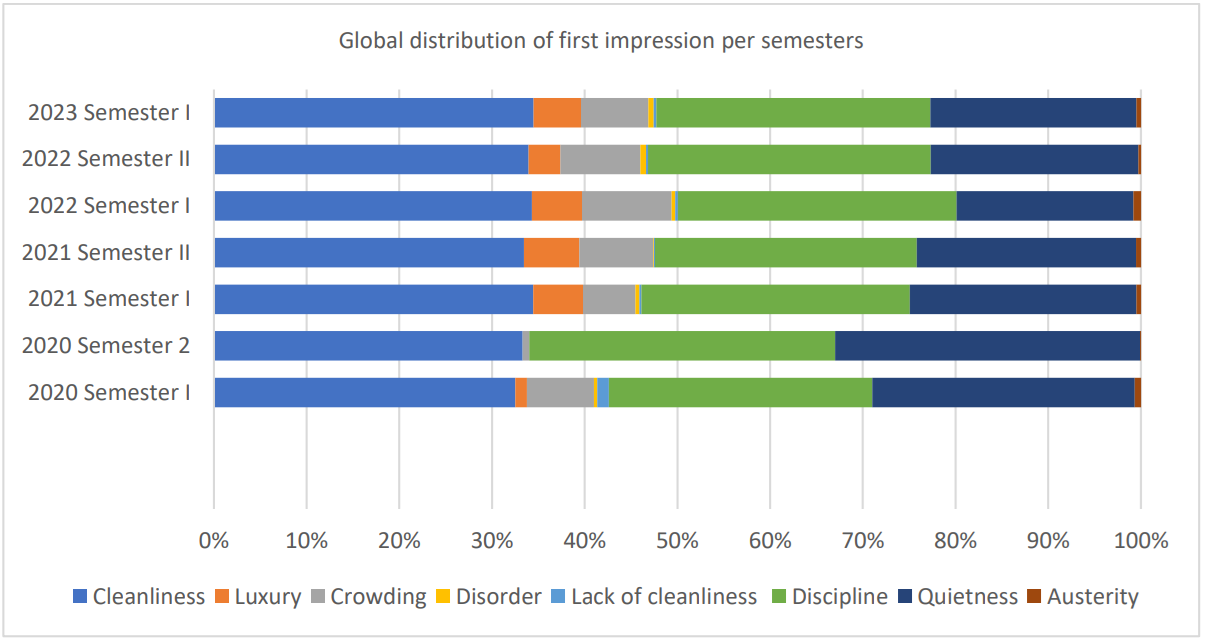
First impression of the patients about QoC was constant during the COVID-19 pandemic, most of them characterizing the reception area as clean, quiet and disciplined (Figure 5). Lack of cleanliness or disorder was reported by very few patients. After cleanliness, discipline and quietness, a small percentage of people mentioned that the reception area was crowded (6.73%). This can be observed starting with the second year of COVID-19 pandemics, first year being reported as less crowded. In the first year of the COVID-19 pandemic the compartment that reported the most crowding was Pneumology, followed by Gynecology, remaining years being followed by Infectious diseases with high percentage.
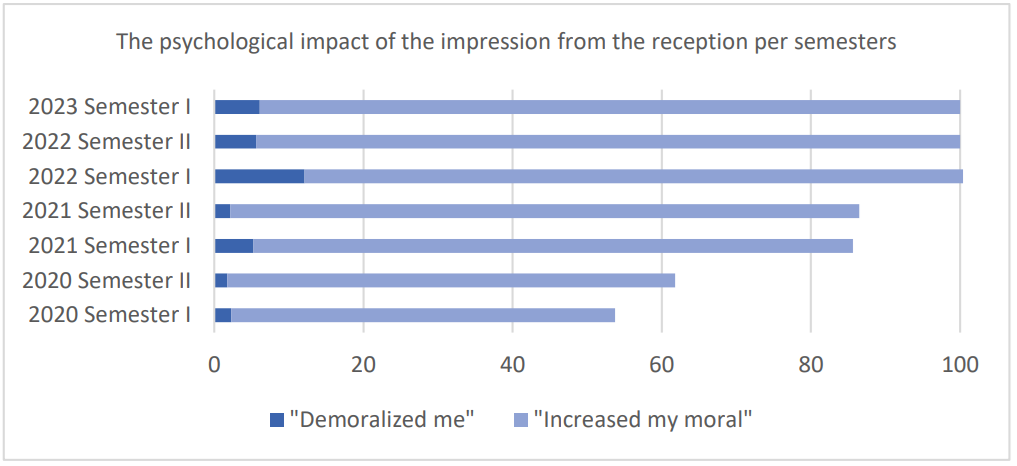
As a result of the appreciation of the reception conditions, 78.98% of people said their morale was boosted and only a small percentage of 5.03% were demoralized. For the remaining 15.98%, the reception conditions had no effect on perception (Figure 6). Patients were more indifferent to reception details in the first year of the COVID-19 pandemic. The impact increased the closer we got to the end of the pandemic.
The majority of patients presented to the hospital with a referral from their general practitioner (56.69%), followed by the percentage of patients who presented from the emergency room. It is noted that in the first year of the pandemic the percentage of patients presenting to the emergency room was lower than in subsequent years of the pandemic.
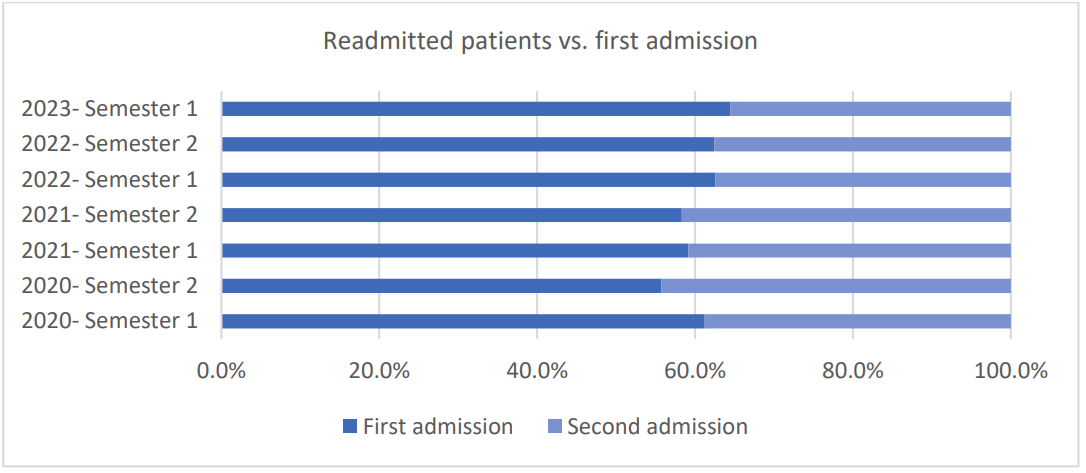
Most patients were at their first hospital admission (60.54%), but still a significant percentage had recurrent admissions (39.45%). There is a trend towards a decrease in recurrent hospitalizations as we approach the end of the pandemic (Figure 7).
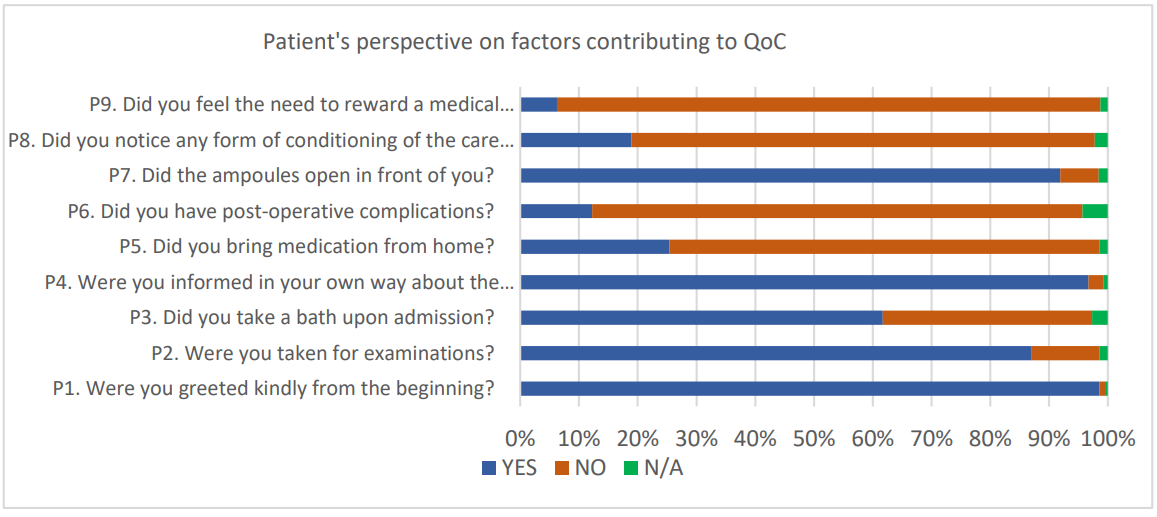
Regarding patient’s perspective about specific items included in QoC (e.g. like greeting, accompanying investigations, taking a bath upon admission, being informed in an understandable way about their condition, bringing medication from home, having post-operative complications, opening the medicine vials in front of them, about noticing any form of conditioning or feeling the need to reward medical acts) overall, patients reported a positive experience.
A percentage of 98.54% of patients felt kindly greeted, and also a very high percentage of them, 96.67%, were informed in an understandable way about their condition. During the COVID-19 pandemic, only 61.67% of people admitted to all medical wards took a shower upon admission, with a slight increase in the first semester of the second year of the pandemic (68.04%), and slightly decreasing towards the end of the pandemic, respectively 53.46% in the 3rd semester of 2022. Regarding medication availability during this period, 25.41% of patients had their personal medication, but the majority of patients received it from the hospital (73.16%) (Figure 8).
Patient’s perspective about the services experienced during hospitalization between 2020 and first semester of 2023 was evaluated through these items: staff attitude at reception, staff attitude during their stay, medical care given by the doctor, nursing care, care given by nurse aides, post-op and ICU care, quality of meals, room and facility conditions, sanitary conditions (bathrooms, toilets) and overall cleanliness. The answers were rated on a scale of 1 to 5, where 1 means “very poor” and 5 means “very good”. The majority of services were rated as “good” or “very good”.
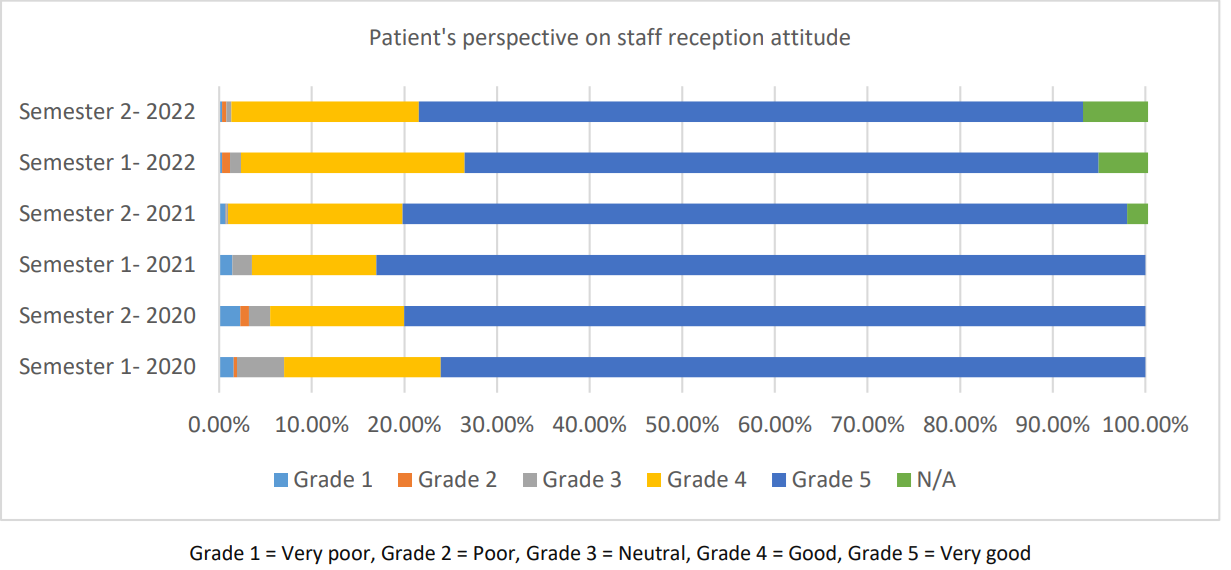
The attitude of the medical staff and the care provided were very good (answers 4+5) for patients in a proportion of over 94.26%, while a minority of 1.55% qualified staff at the reception as “very poor” or “poor”.
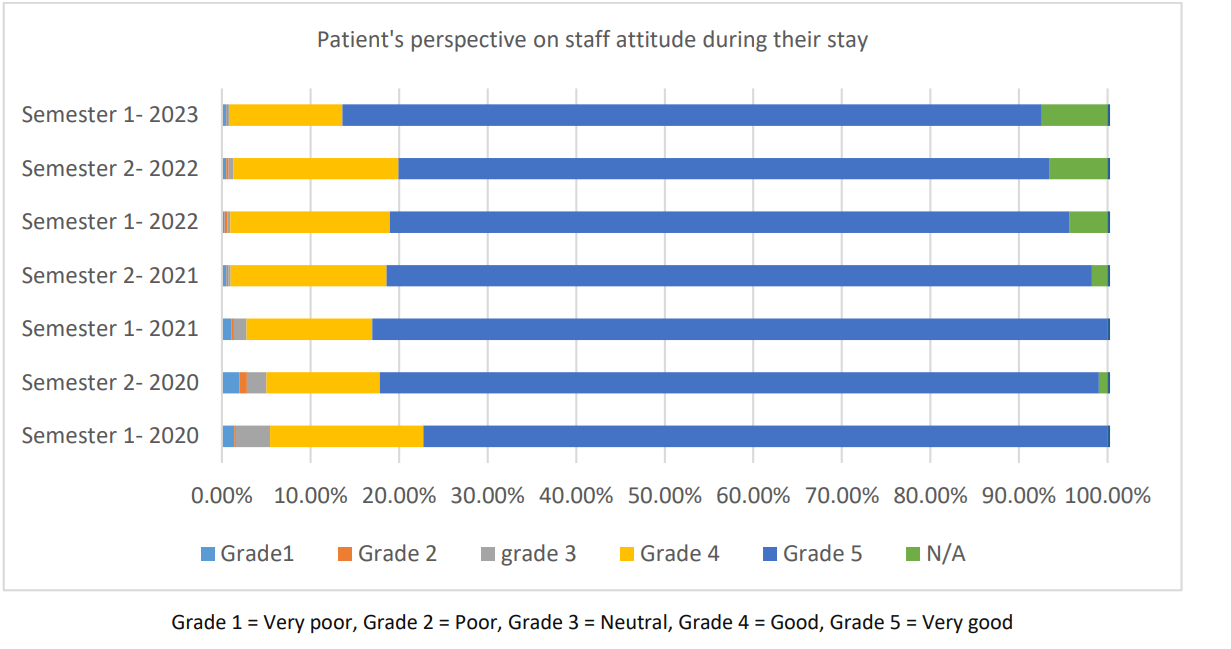
Later, during hospitalization, patients’ opinions about the attitude of the medical staff remained favorable, 87% of them characterized it as good and very good (Figure 10).
Regarding the care provided by doctors, nurses and auxiliary care staff, it was assessed as “good” and “very good”, in very high percentages: doctors – 94.84%, nurses – 94.93%, and nurse aids – 94.00% (Figure 11, Figure 12, Figure 13).
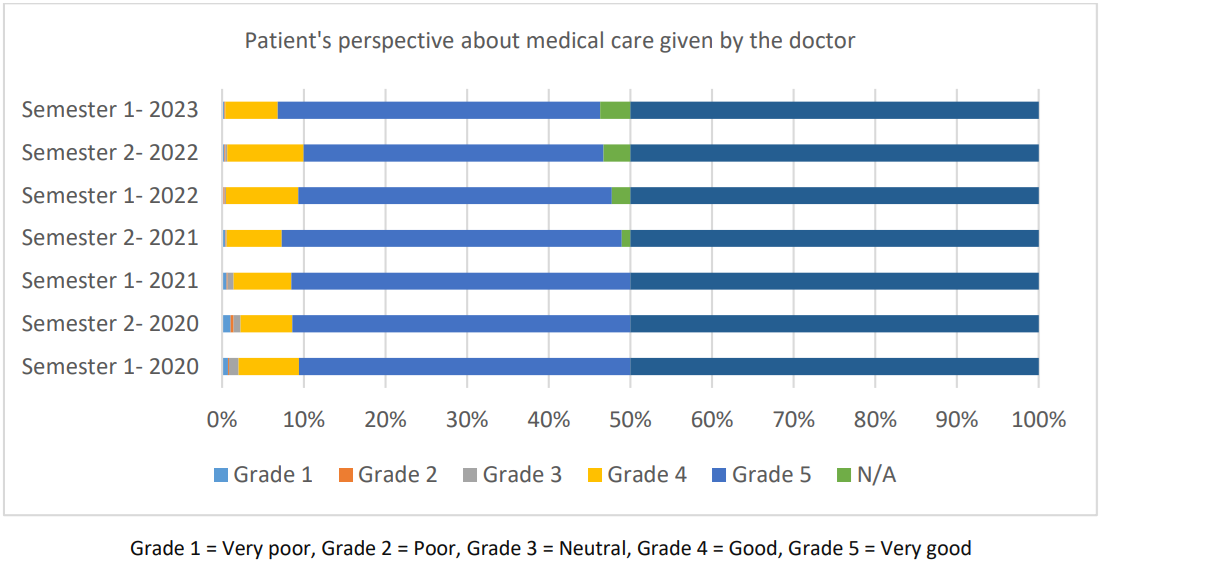
It can also be observed that the highest percentage of “very good” ratings regarding the care provided by doctors is found in 2021 (semester 1 + semester 2) (Figure 11). The highest scores for care provided by doctors: Surgery I and II, Internal Medicine I, with >95% ratings of “very good” and “Good”.
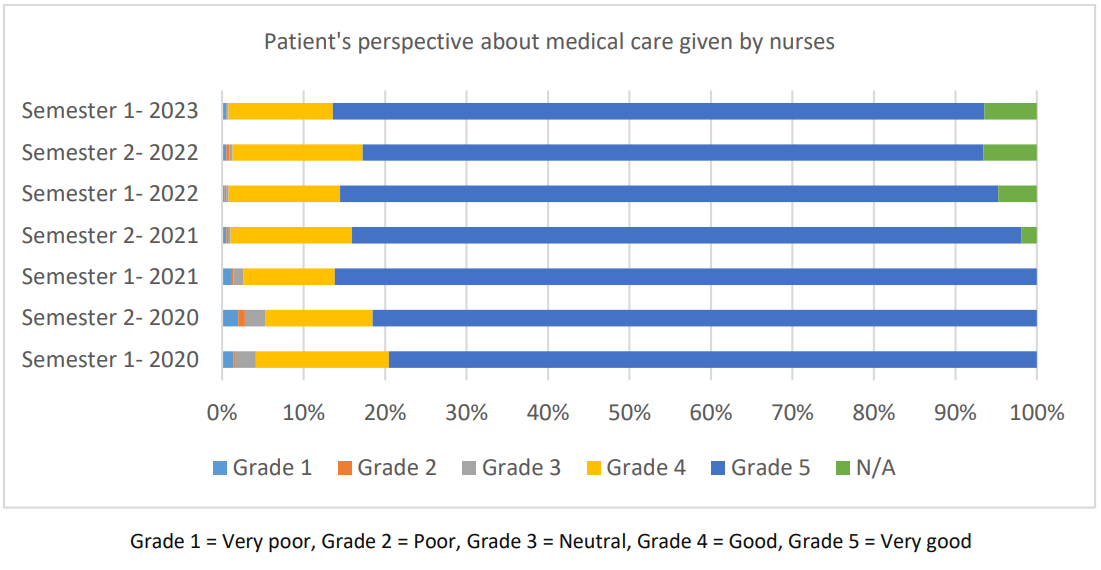
Also, medical care given by nurses was appreciated most during 2021 (Figure 12). Care provided by nurses: was consistently above 94% for most departments.
Regarding the care provided by nurse aids, the highest percentage of “very good” ratings is found in the 2nd semester of 2020 and the 1st semester of 2021.
Comparing with others QoC indicators from the patient’s perspective, the quality of meals was slightly lower than the others, but still with a high percentage of “good” and “very good” qualifiers- 88.56% (Figure 14).
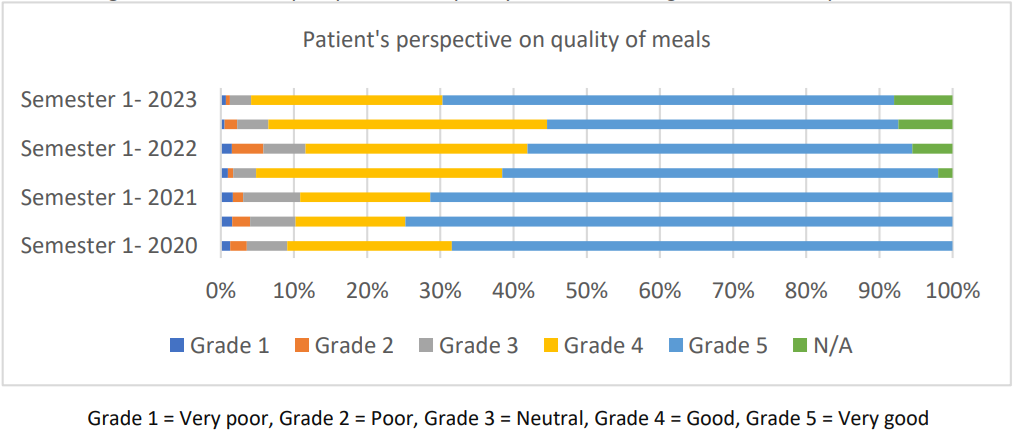
It is also observed that in the first 3 quarters of the COVID-19 pandemic, patients’ opinion of the quality of meals offered during hospitalization was better than in the second half of the pandemic interval.
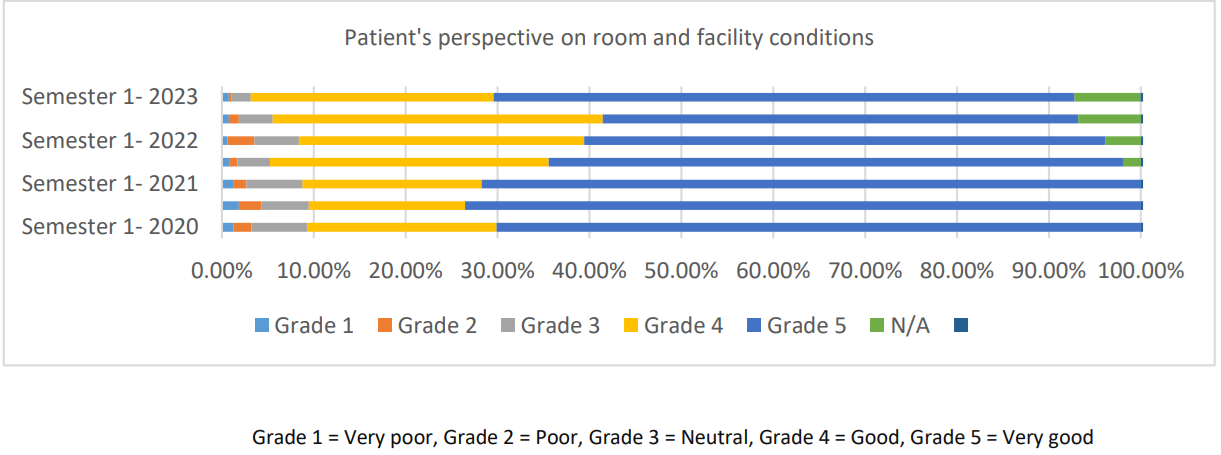
During the COVID-19 pandemic room and facility conditions were characterized by 64.22% of hospitalized patients as being “very good”, and also “good” by 25.84%, giving the overall impression that in general, they were pleased with the accommodation conditions. (Figure 15).
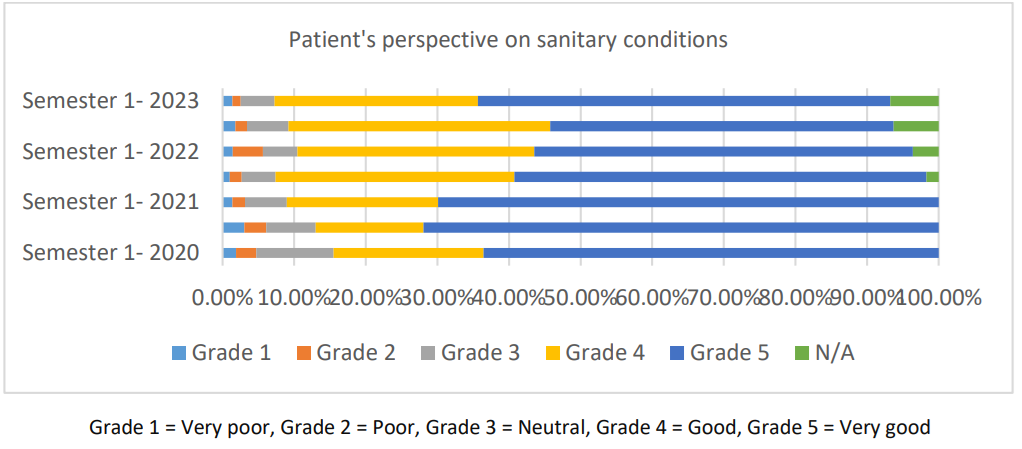
Regarding sanitary conditions, only 60.19% of patients reported very good conditions, while 26.95% referred to them as being “good”. Overall, bathroom and toilet conditions were among the least appreciated qualifiers, even though, in total, the percentages of the 2 qualifiers (grade 4 + grade 5) that positively characterize these conditions are 87% (Figure 16).
The best perception of the sanitary conditions was in the second semester of 2020, and the worst perception was towards the end of the COVID-19 pandemic, in the second semester of 2022. (Figure 16).
Overall cleanliness was appreciated in proportion of 92% of the patients, while just 2% was not satisfied with the level of hygiene (Figure 17).
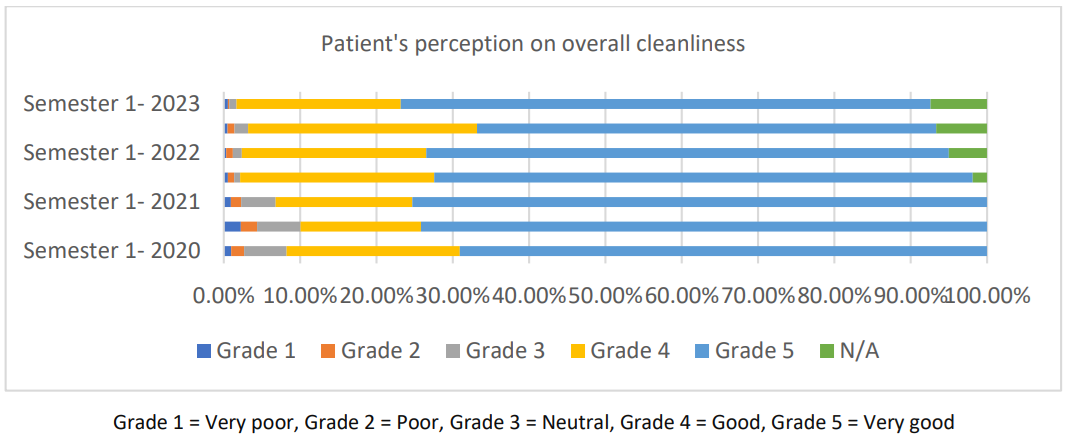
Regarding the distribution per semester, most patients who characterized hygiene as being “very good” were hospitalized between the second semester of 2020 and the first semester of 2021.
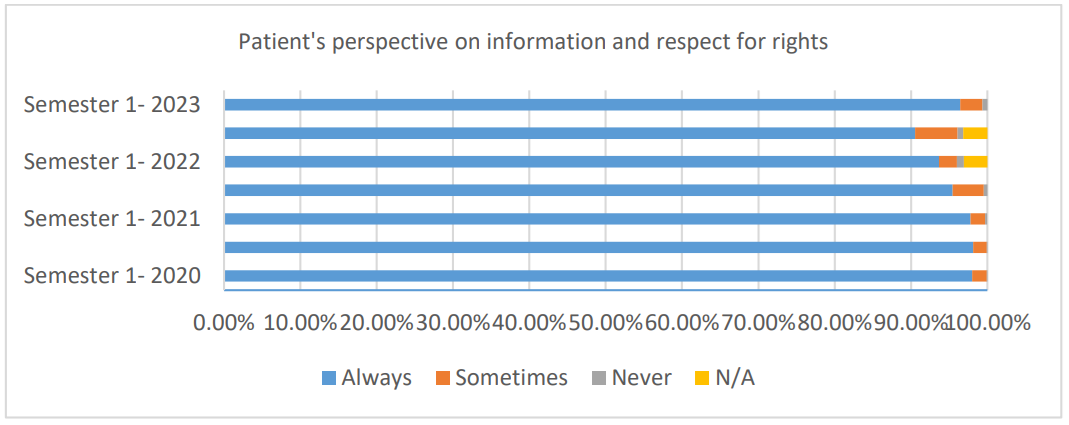
Regarding question number 7, the majority of patients believed that they were informed about their rights and that they were respected. A discrete decrease in perspective toward the end of the COVID-19 pandemic can be noticed (Figure 18).
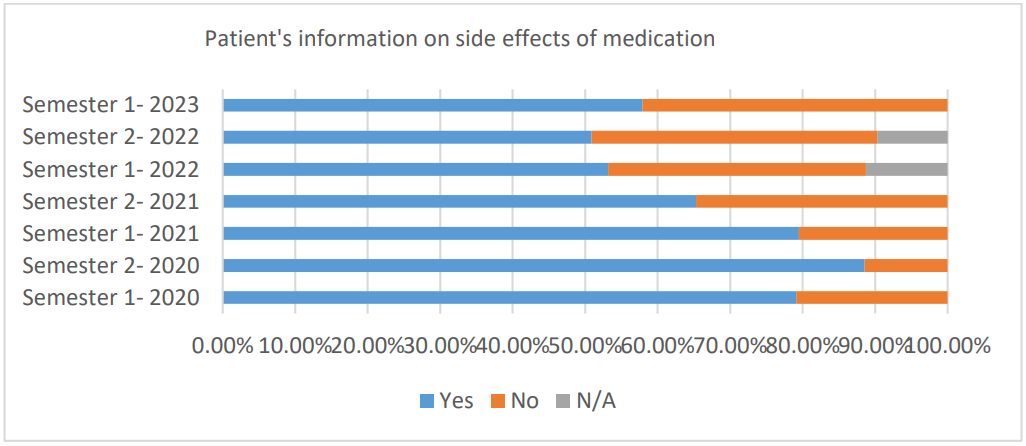
Most patients were informed about the side effects of the medication, but the percentage is significantly increased in the first part of the COVID-19 pandemic (Figure 19).
Also, the majority of patients, 93.13%, was informed about the risk of falling into the hospital (Figure 20).
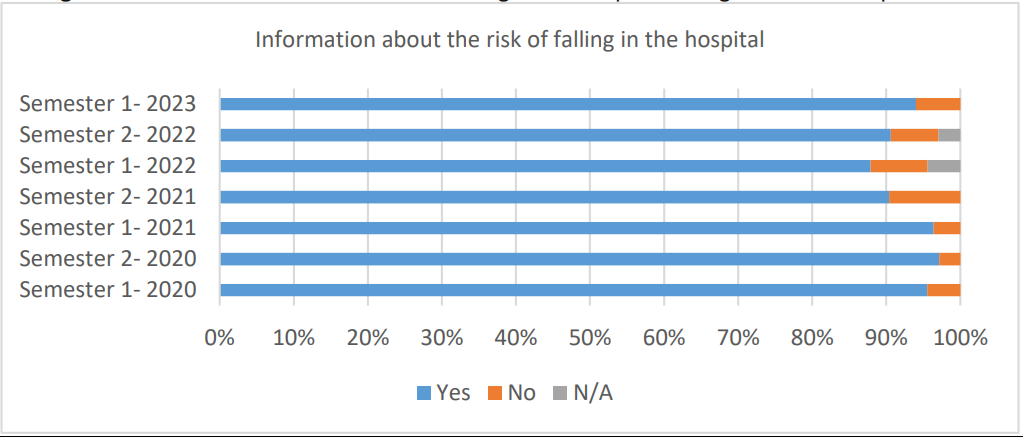
The highest percentage of uniformed patients was in the second semester of 2021, in the middle of the COVID-19 pandemic (9.6%) (Figure 18).
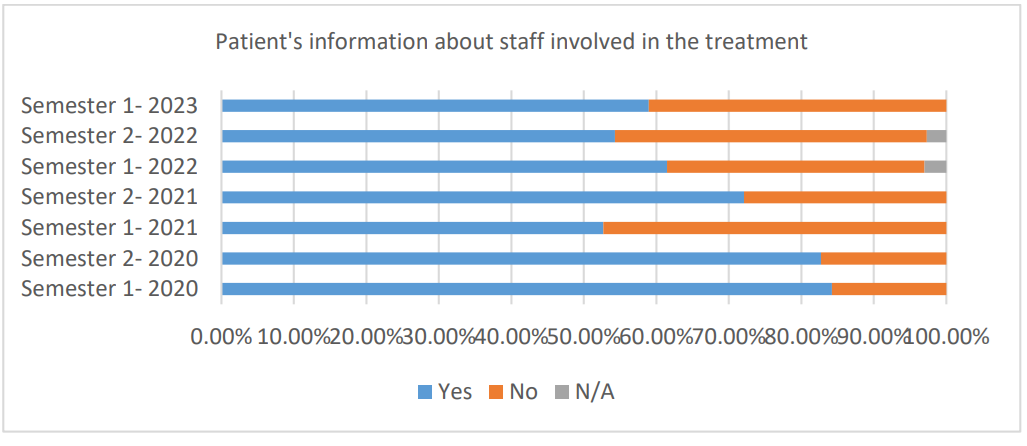
A percentage of 66.63% of patients reported knowing about the identity and/or professional status of the medical personnel involved in the treatment administered (Figure 21).
Given the specific items analyzed, patients were asked about overall satisfaction, and the opportunity to return (if needed) and about recommending the hospital services to others (if needed).
Overall, 92.76% of hospitalized patients during the COVID-19 pandemic reported being satisfied with their experience, with 64.34% “very satisfied” and 28.42% “satisfied” (Figure 22).
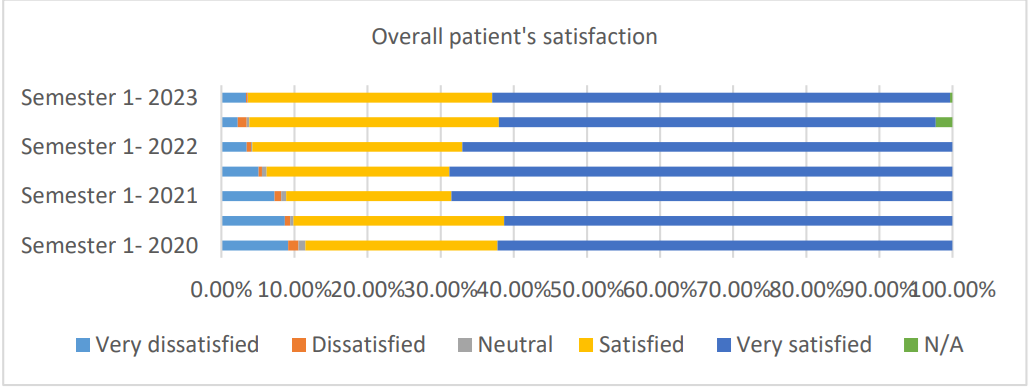
Patient’s satisfaction was lower in the first year of the pandemic but increased over time. Regarding willingness to return, 70.87% of patients stated they would “definitely return” if needed (Figure 23). Similarly, 60.23% indicated they would “definitely recommend” the hospital to others requiring medical care (Figure 24).
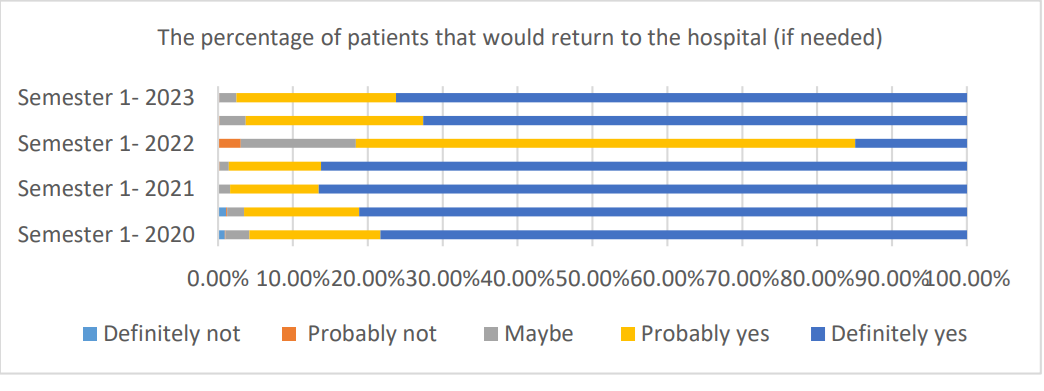
Notably, in the first semester of 2022, confidence declined, with more patients responding “probably return” or “probably recommend” compared to other periods, suggesting a temporary dip in trust during mid-pandemic phases.
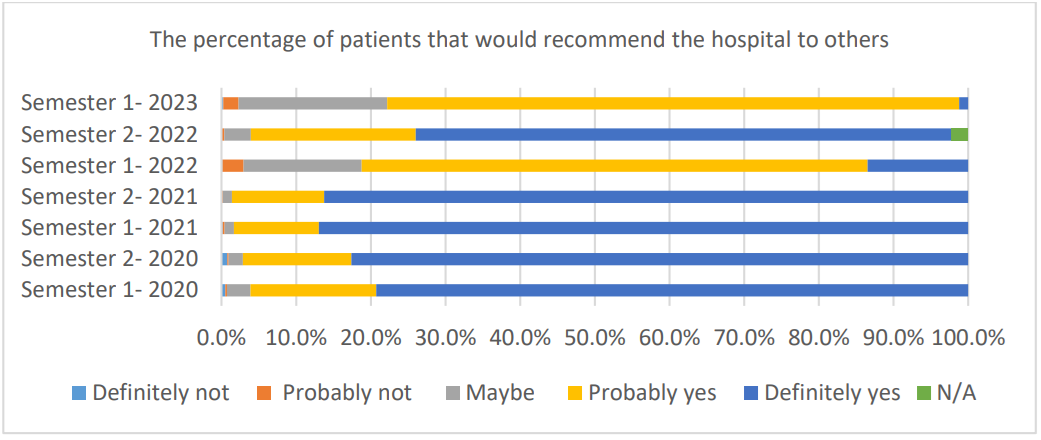
Patients were asked about overall satisfaction, willingness to return if needed, and likelihood of recommending the hospital to others. Overall, patient satisfaction strongly correlated with willingness to return and recommend the hospital, reinforcing its role as a key indicator of perceived quality of care, and 91,87% would recommend the hospital, 94.98% would return to the hospital, if necessary, and overall patient satisfaction was 92.76%.
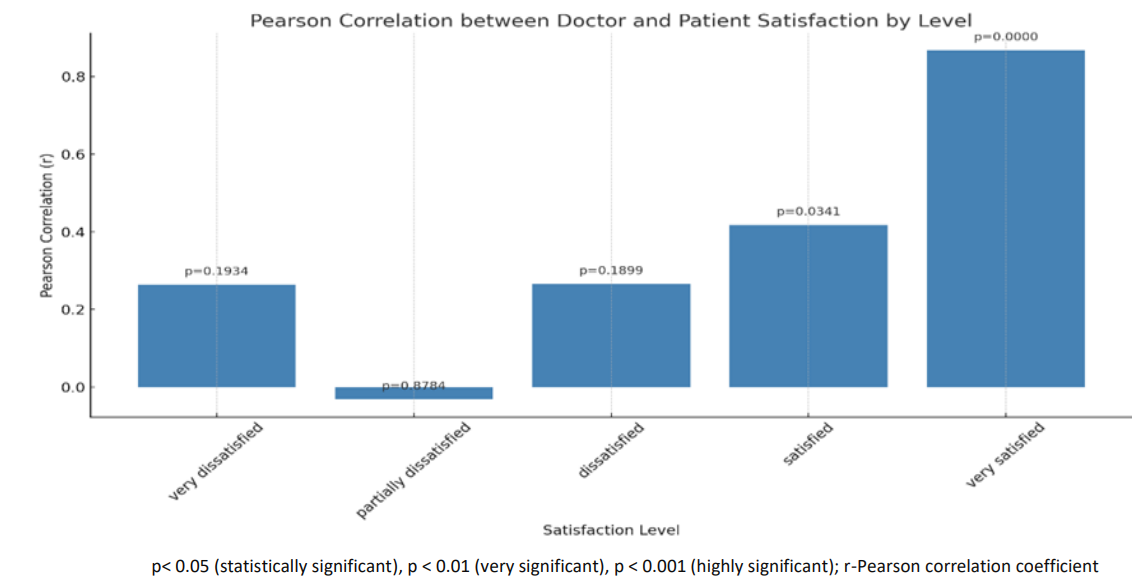
The Pearson correlation analysis revealed a strong positive relationship between the percentage of “very satisfied” patients and satisfaction with doctor care across departments (r = 0.867, p < 0.00000001). A moderate positive correlation was observed for the "satisfied" category (r = 0.417, p ≈ 0.034) (Figure 25).
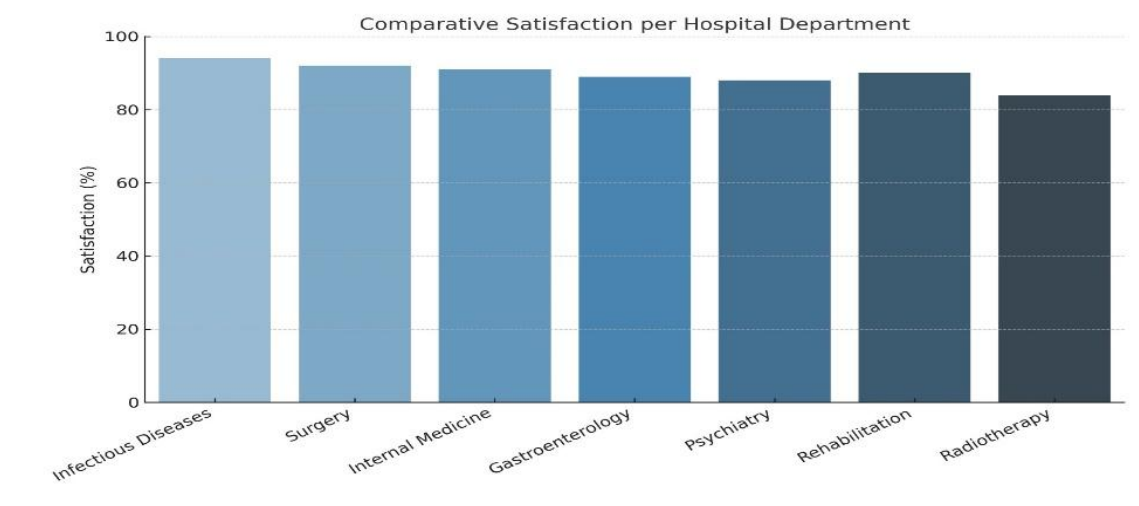
Comparative satisfaction rates across major hospital departments showed the Infectious Diseases department achieving the highest satisfaction (above 92%), followed by the Surgical departments and Internal Medicine (close to 91%). Gastroenterology and Psychiatry scored around 88-89%, while Physical Medicine and Rehabilitation maintained high satisfaction at around 90%, likely reflecting both the importance of rehabilitation post-infection and strong patient-provider relationships. Radiotherapy recorded slightly lower satisfaction (around 84%), possibly reflecting challenges faced by oncology patients during pandemic-related disruptions (Figure 26).
Correlation between overall satisfaction and readmission count per department indicated a moderate negative relationship (r = -0.48, p = 0.012), suggesting that higher satisfaction was associated with fewer readmissions. This supports the hypothesis that quality of care impacts clinical outcomes (Figure 27).
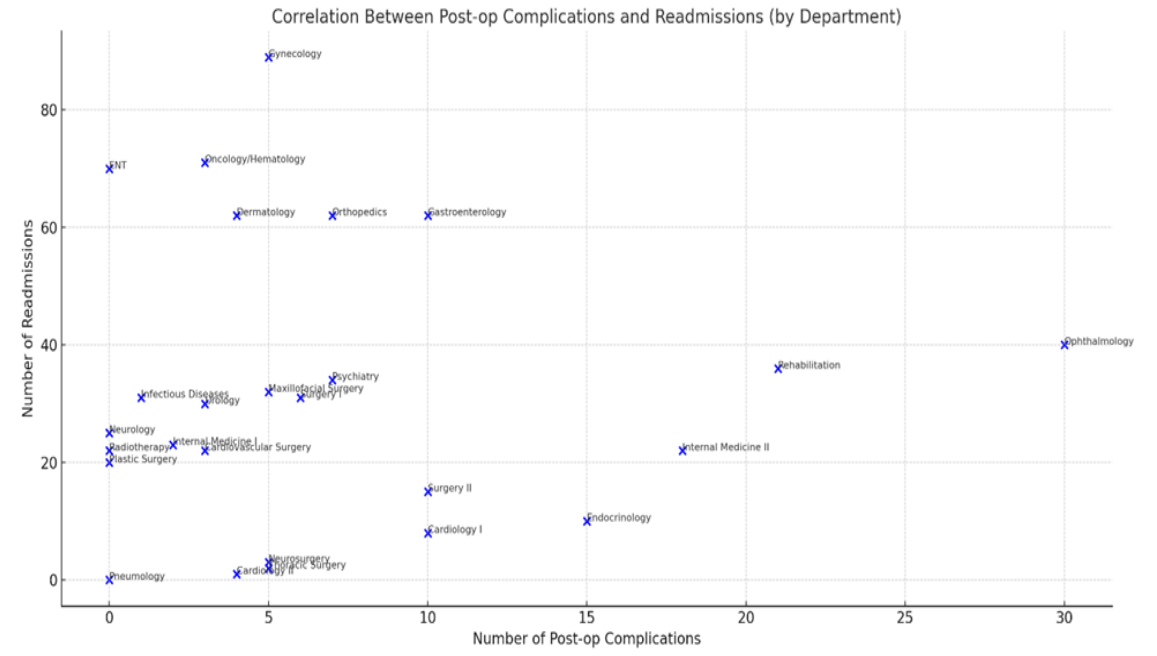
Analysis of post-operative complications and readmissions revealed a very weak, non-significant correlation (r = 0.041, p = 0.84), indicating that complications alone do not predict readmission rates (Fig.27). Other factors, such as discharge practices, follow-up care, and comorbidities, likely play a role. Departments like Gynecology, Onco-hematology, and Psychiatry showed high readmission rates despite low complication numbers, while Surgery I, Internal Medicine II, and Cardiology I exhibited more aligned patterns. Plastic Surgery and Maxillofacial Surgery had zero complications and zero readmissions, suggesting effective treatment or less complex cases.
The strongest statistically significant correlation was observed between Internal Medicine I and Thoracic Surgery (r = 0.997, p = 0.0002), Internal Medicine I and Radiotherapy (r = 0.997, p = 0.0002) and Cardiology II and Plastic Surgery also exhibited perfect correlation (r = 1.000, p < 0.0001), indicating near identical patient satisfaction distributions across these departments.
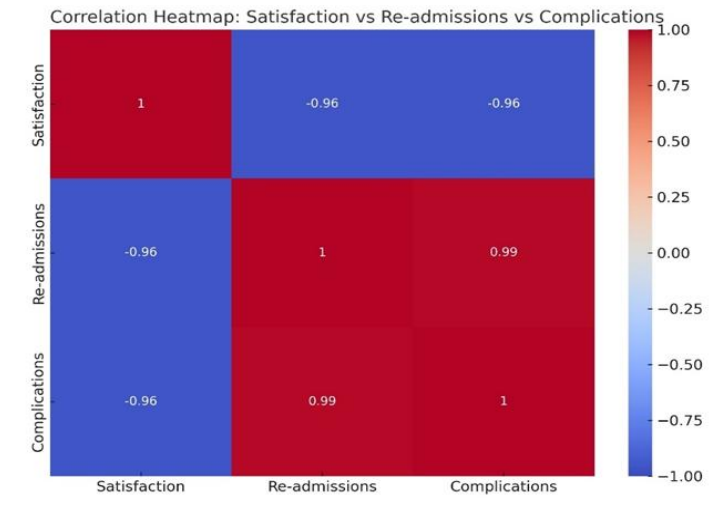
A correlation analysis was performed to assess the relationships between overall patient satisfaction, readmission rates, and postoperative complication rates across hospital departments (Figure 28). The results demonstrated a strong negative correlation between patient satisfaction and both readmission rates (r = -0.96) and complication rates (r = -0.96), meaning that higher satisfaction was linked to fewer readmissions and fewer complications. Readmission rates and complication rates were highly positively correlated (r = 0.99), meaning that more complications were closely associated with more readmissions. These findings highlight a robust interdependence between perceived quality of care, clinical outcomes, and patient experience within the hospital setting (Figure 28).
We compared our hospital with a theoretical surge-ready hospital model [16] to determine which system-level deficiencies most strongly influence patient experience and safety during pandemics. This comparison shows where resources should be directed (ICU surge capacity, admission control, staffing reserves, telemedicine) and establishes measurable goals (Composite Risk Index ≤0.70, reduced Emergency department congestion, improved team recognition) for future preparedness.
Hospitals behave like complex adaptive systems[17]: small changes (staff stress, bed occupancy) can have disproportionately large effects on patient safety. Fractal concepts capture how similar patterns repeat from ward to unit to hospital, and how consistency at each level helps keep the system stable. To build a mathematical model, based on nonlinear dynamics and fractal theory of a hospital operating with near-zero risk and to compare it with the Central Military Emergency University Hospital “Dr. Carol Davila,” we first defined the parameters of the fractal, nonlinear model:
Integrating fractal theory with nonlinear dynamical systems allows us to treat patient safety and hospital workflow as a complex adaptive system. Its main components are:
A fundamental equation for an ideal hospital patient safety management system could be:
dS/dt = −αS + βP − γE
S = patient safety, α = the rate of safety degradation driven by systemic risks, β = effect of prevention and of the improvement measures taken, P = proportion of patients who comply proportion of patients who follow safety and hygiene rules, γ = the rate at which medical errors and hospital acquired infections rise, E = stress level among medical staff, a non linear determinant with a direct effect on performance and error risk.
If we model the hospital as a fractal system, the fractal dimension D can be calculated as: D = lim (r→0) log N(r) / log (1/r)
N(r) is the number of repeating units of the hospital (wards, teams, checkpoints) at scale r. For an ideal hospital, this ratio should be optimized so that the organizational structure minimizes chaos. An ideal hospital should optimize this dimension to prevent bottlenecks in patient flows.
| Criterion | Ideal Hospital | “Dr. Carol Davila” Central Military Emergency University Hospital |
|---|---|---|
| ICU capacity and infrastructure | Flexible infrastructure with the ability to rapidly expand ICU beds. | ICU expansion achieved, but with logistical challenges and increased pressure on staff. |
| Risk management | Early implementation of integrated risk plans, fractal simulations, and predictive scenarios. | Reactive protocols adapted as the situation evolved; limited predictability initially. |
| Transmission control | Strict control via selected teams and advanced triage, reducing in-hospital transmission risk. | Triage was partially applied; selected teams implemented to a limited extent; some wards experienced internal outbreaks. |
| Composite Risk Index (ICR) | Maintained below θ ≈ 0.7, indicating epidemiologic stability. | Elevated values, especially in ICU and Internal Medicine (ICR ≈ 0.85), exceed the critical threshold. |
| Adverse events | Mean density ≈ 3,000 per unit area, with minimal variation across wards. | ICU and Internal Medicine showed extreme densities (>10,000), indicating overload. |
| Fractal complexity | DH ≈ 1.2, indicating a more uniform distribution of cases and good cluster control. | DH ≈ 1.5 in the Emergency Department and Surgery → heterogeneous distribution, concentrated clusters, hard to control. |
| Admission control | Time-slotted appointments, digital scheduling flows, and reduced pressure on the Emergency Department. | Sudden surges in patient inflow- significant congestion periods in the Emergency Department. |
| Workforce | Additional support teams, intensive training, and minimal burnout. | Elevated fatigue, stress, and burnout, with accelerated turnover among ICU staff. |
| Technology and telemedicine | Integrated remote-monitoring systems and full teleconsultation capabilities. | Telemedicine was partially implemented; many acute cases required in-person evaluation. |
To compare the mathematical model of an ideal hospital with the real situation at the “Dr. Carol Davila” Central Military Emergency University Hospital, we extracted relevant information from documents on nosocomial (hospital-acquired) infections, patient safety, and the hospital’s performance during the pandemic. Neural networks and machine-learning systems are used to detect patterns in the occurrence of infections and to automatically identify and correct their sources. Risk-adjustment formula for infections: Rt = R0e−δt. Rt is the infection rate at time t, R0 is the initial infection rate, and δ is the attenuation coefficient representing the reduction of risk through prevention measures.
The analysis is based on data from the document “Quality of care during the COVID-19 pandemic patients’ perspective” (“Dr. Carol Davila” Central Military Emergency University Hospital, 2020-S1 2023), which describes the data-collection methodology, indicators, and results on satisfaction and perceived quality.
The Composite Risk Index (CRI) consolidates clinical pressure (occupancy, adverse events), distribution complexity (fractal proxy), and operational factors (flow, readmissions)[26] into a 0-1 scale. For S.U.U.M.C., the profile was composed from patient questionnaire results and operational indicators from the beginning of 2020 to the first semester of 2023, while the theoretical hospital profile assumes ward values between 0.30 and 0.50, and ICU <0.65.
The analysis links the CRI benchmarking (S.U.U.M.C. versus ideal hospital) with all CRI correlation outputs, such as event density, readmissions, utilization and fractal complexity (DH or Df). Results are reported using Pearson correlation for linear and Spearman correlation for monotonic correlations. Threshold: p < 0.05.
According to CRI, risk is clearly stratified across medical services in the hospital, ICU being above the critical threshold of θ ≈ 0.85 and also beyond the ideal theoretical hospital target, which makes it a priority for urgent intervention. According to the report, they should introduce timed admission slots, strict cohorting with defined intervention teams, and maintain a capacity buffer in order to minimize the chaos.
Surgery and Internal medicine were the wards that showed intermediate CRIs, approximately 0.58- 0.59, with positive deviation from the target. These units should be prioritized for optimization.
The Emergency Department (ED) shows a moderate risk, with a Cri approximately of 0.54, meaning that they could improve or implement digital triage and better coordinate with the outpatient clinic in order to manage arrival peaks.
Gynecology and Orthopedic surgery have a good CRI, suggesting that they don’t need a major change in their practice.
Ambulatory services showed the lowest CRI ( approx. 0.24) and can relieve pressure from the ED.
These priorities are based on CRI from 0 to 1, which include occupancy, adverse event density, and readmissions, and they are consistent with resilience principles of reducing ICU and ER overload and developing ambulatory capacity in order to absorb demand.
This study presents a comprehensive evaluation of quality of care (QoC) in a military hospital during the COVID-19 pandemic, based on patient satisfaction data from the “Patient Satisfaction Questionnaire- Continuous Hospitalization”, clinical outcome and qualitative data collected across all medical wards across the S.U.U.M.C. “Dr. Carol Davila.” Data were extracted from all medical hospital departments because COVID-19 is a multisystem disease, affecting cardiovascular, neurological, renal, and musculoskeletal systems, thereby increasing demand across diverse specialties, including medical, surgical, and rehabilitation services [27]. Our findings align with international reports and highlight how patient perspectives can inform the reorganization of medical services during health emergencies. Similar observations have been reported in tertiary care studies during the pandemic, where effective communication and physician engagement were key drivers of patient experience [28].
Across departments, the percentage of patients who reported being “very satisfied” with doctor care strongly correlated with overall satisfaction. Similar observations have been reported in tertiary care studies during the pandemic, where effective communication and physician engagement were key drivers of patient experience [28].
Nursing care consistently achieved high satisfaction levels (>94%), reflecting strong leadership, multidisciplinary teamwork and effective communication, factors repeatedly identified as determinants of QoC in the literature. Across most wards, nursing care was achieved [29].
In our hospital, patient satisfaction was lower in the first year of the pandemic (2020) and improved thereafter (2021- first semester of 2023), a trend likely explained by initial operational shocks (surges, staff shortages, reconfigured pathways) followed by organizational learning and stabilization. This pattern mirrors findings from HCAHPS (Hospital Consumer Assessment of Healthcare Providers and Systems) -based studies reporting declines in staff responsiveness and cleanliness during the early pandemic phase [30].
In our cohort, 66.63% of patients reported knowing the identity or professional role of the clinicians involved in their care. This decrease may be attributed to infection-control measures, including masks, visors, or gowns, which obscured faces and badges. Literature confirms that protective equipment can hinder recognition and communication, and interventions such as photo badges, transparent masks, and standardized introductions improve identification [31]. Higher patient satisfaction correlated with willingness to return and recommend the hospital, reinforcing its role as a proxy for QoC. This is consistent with standardized programs such as HCAHPS, where global items-overall rating and “would recommend”-summarize patient perceptions of care quality. Hospitals performing well on these measures tend to show stronger recommendation intent, supporting our findings [32].
Departments such as Infectious Diseases and ROL2 experienced significant strain, managing the highest COVID-19 caseloads between 2020 and 2023. Peak admissions during initial waves necessitated resource reallocation, staff redeployment and establishment of new facilities (such as the COVID-19 Evaluation Center). Similar strategies were reported globally, including ICU extensions, rapid testing units and triage centers [33].
Surgical wards, gynecology, dermatology and ENT experienced a significant reduction in patient volume due to restrictions on non-urgent procedures. The COVIDSurg Collaborative estimated that approximately 28.4 million elective operations were canceled globally during a 12-week peak, with a median of 45 weeks required for recovery, explaining the marked volume reductions observed in Surgery, Gynecology, Dermatology, and ENT [34].
Across wards, patients’ satisfaction and clinical outcomes varied. At our tertiary military hospital, Infectious Diseases achieved the highest satisfaction (92%), consistent with literature reports that COVID-dedicated units maintained high ratings and strong recommendation intent despite operational strain, likely reflecting clear communication, visible infection-control measures and cohesive workflows in cohorted departments [35].
Patients in some wards reported difficulties obtaining tests and treatments, contributing to perceptions of lower service quality. Crowding and resource constraints were noted, consistent with studies showing that COVID surges drove crowding, diagnostic delays, and care interruptions as bed occupancy and ICU load increased, reducing operational performance and patient experience [36].
Our results show marked changes in hospitalization types during the pandemic. Between 2020 and 2021, most COVID-19 patients were admitted for continuous care due to deteriorating clinical conditions and the absence of effective outpatient therapies. From 2022 onward, the implementation of antiviral medicines, expanded testing and vaccination [37], increased day hospitalization, altering treatment strategies and patient profiles; this trend was also reported in other studies [38]. Since 2023, the sharp decline in COVID-19 admissions led to the relaxation of previously established safety regulations. This shift demonstrates the healthcare system’s adaptability in modifying protocols and optimizing hospital resources.
Despite systemic stress, 94% of patients reported staff care as “good” or “very good” and over 94% were satisfied with care provided by physicians, nurses and aides. While room cleanliness and comfort scored well, bathrooms and toilets were rated “very good” by only 60% of patients. These findings are consistent with reports that staff professionalism and clinical care remained highly valued under surge conditions, even when operational stress degraded facility aspects such as responsiveness or cleanliness [28,30,39,40].
Patient perspectives served not only as a mirror but also as an indirect driver of QoC during the pandemic. High satisfaction levels correlated with fewer readmissions and complications, suggesting that positive patient experiences may promote better communication, adherence, and early identification of complications. This relationship is supported by multiple studies, including among adults with chronic health conditions [41].
Our results suggest that patient with high scores in doctor communication, discharge clarity and coordinated follow-up had lower readmission rates and smoother recovery. From a system perspective, these findings may reduce long-COVID functional limitations by accelerating rehabilitation access, preventing deconditioning and enabling self-management. Implementing timed admissions, dedicated staff, digital triage, standardized discharge, early follow-up, and telerehabilitation provides a practical pathway to lowering the post-COVID disability burden [42]. These findings mirror international evidence, suggesting that patient-reported experience measures (PREMs) influence QoC, with measurable effects on clinical outcomes, safety and resource utilization [43].
The comparison between S.U.U.M.C.’s department level of CRI and an ideal theoretical hospital highlighted specific opportunities linked to patient-facing outcomes. Wards exhibiting higher fractal complexity (heterogeneous, highly variable flow) show higher CRI at similar occupancy levels, suggesting that arrival variability and fragmented processes increase operational risk. This explains why the Emergency Department and perioperative pathways, which are more variable, showed a higher risk than ambulatory areas (where most people were scheduled) at similar overall volumes. Lower CRI values were associated with smoother communication and higher satisfaction. This highlights that strengthening admission control and expanding outpatient capacity reduces risk and improves patient experience.
However, staff identification during the pandemic could have been improved, as protective equipment obscured visual cues and hindered recognition.
Our findings demonstrate that patient perspectives on physician care serve as a strong marker and enabler of high-quality care, even during stressful periods such as the COVID-19 pandemic. Overall, patients reported high levels of general satisfaction, particularly in their interaction with medical staff. However, staff identification during the pandemic could have been improved, as protective equipment obscured visual cues and hindered recognition.
The direct relationship between perceived quality of care and readmission rates underscores the value of patient experience as a metric for quality management. The results can help plan for future health emergencies, highlighting the need for operational flexibility, clear communication, empathy, and teamwork.
Benchmarking “Dr. Carol Davila” Central Military Emergency University Hospital against an ideal surge-ready hospital profile identified actionable priorities: stabilizing ICU risk through timed admission and strict cohorting, standardising high-variability pathways in departments (like Surgery and Internal medicine), digitalising front-end triage (in the Emergency Department), and integrating all departments with ambulatory scheduling to prevent demand spikes.
The authors declare no conflict of interest.
This research received no external funding.
The authors would like to express many thanks to the administrative and technical support: Catalina Clinci
Conceptualization, C.U. and M.B.; methodology, C.U.; software, R.I.N.; S.B; data curation, R.I.N.; writing-original draft preparation, C.U. and I.C.; writing-review and editing, C.U., S.B., and I.C.; supervision, E.C.; project administration, R.I.N.; visualization, M.N.P. All authors have read and agreed to the published version of the manuscript
The study was conducted in accordance with the Declaration of Helsinki, and approved by the Institutional Review Ethics Committee of S.U.U.M.C. “Dr Carol Dvila” according to P.V. 824/09.10.2025
Not applicable