
The COVID-19 pandemic changed a lot about how emergency hospitals work. It showed that the system wasn’t very resilient and that clinical coordination and infrastructure were problems. The facilities in Northeastern Romania, especially those in Iași and Bacău, were hit the hardest. While under a lot of stress, they had to make tough decisions about how to move patients, how to keep infections from spreading, and how to keep staff available. Conventional linear approaches to hospital risk management, reliant on a direct and proportional correlation between cause and effect, proved inadequate for comprehending or forecasting the temporal evolution of pandemic-induced disruptions [1]. The healthcare system displayed traits typical of nonlinear complex systems, where slight modifications in initial
conditions—like a short delay in triage or the absence of critical personnel [2]—could lead to disproportionately large effects on infection transmission or clinical outcomes [3,4].
The conceptual basis for comprehending such behaviors is rooted in nonlinear dynamics, or chaos theory—a mathematical framework that analyzes systems influenced by feedback mechanisms, wherein outputs perpetually alter their own inputs over time [5]. Including in post-COVID-19 respiratory rehabilitation, fractal theory and nonlinear dynamics were applied [6]. From this viewpoint, hospitals experiencing pandemic stress can be seen as open, adaptable systems made up of interconnected clinical, logistical, and managerial subsystems. Their stability arises from fragile, nonlinear interconnections and constantly evolving external constraints [7]. The transition from orderly to chaotic dynamics in these contexts is frequently characterized by bifurcation phenomena, whereas Lyapunov exponents function as critical metrics for assessing sensitivity to initial conditions and the predictability of the system’s evolution [8].
Mandelbrot [9] was the first to come up with fractal theory. This theory builds on the ideas of nonlinear dynamics by giving us a way to measure and understand how complicated and self-similar dynamic systems are. Fractals show how similar structural patterns repeat at different scales. This was especially clear in hospital risk networks during the pandemic. The patterns of patient influx, infection spread, and resource use over time and space often followed scaling relationships and power-law distributions, which showed that there was a fractal structure [10]. Research shows that pandemics often follow a multifractal pattern over time, with periods of rapid growth followed by periods of partial stabilization [11,12].
The northeastern part of Romania was one of the worst hit by the pandemic because there were a lot of people and not enough resources for intensive care. Hospitals in this area had to change how they worked and how they were built all the time, which led to new behaviors that showed signs of self-organization. Regional assessments revealed that risk transmission—encompassing hospitalacquired infections, staff fatigue, and logistical disruptions—arose from temporal dependencies and nonlinear interconnections akin to those found in complex biological and ecological networks [13].
Using both nonlinear and fractal methods, pandemic risk management can go from a reactive way of dealing with crises to a proactive, predictive, and flexible way of doing things. By finding attractor configurations, measuring fractal dimensions, and keeping an eye on changes in entropy, decision-makers can see important changes between phases of stability and systemic breakdown. This approach aligns with the overarching framework of complex systems theory, which posits that adaptability, feedback regulation, and inter-scale interactions are critical determinants of an organization’s resilience [14].
This research expands upon this theoretical framework by simulating the nonlinear dynamics of pandemic-related risks in an emergency hospital situated in northeastern Romania. It uses mathematical and fractal analytical tools to look at time-series data that shows clinical events, infection trends, and signs of operational stress. The goal is to find the hidden structural patterns and dynamic regularities that shape how hospitals act when they are under a lot of stress. This will help build a quantitative framework that can help with pandemic preparedness and management by supporting strong, data-driven plans.
This study was conducted at the largest tertiary-level emergency facility in northeastern Romania, the “Sf. Spiridon” Emergency Clinical Hospital. There are 25 clinical departments at the institution, and it provides emergency and intensive care to more than 70,000 inpatients each year. The hospital was under a lot of stress during the COVID-19 pandemic (March 2020–December 2022). For example, the number of patients coming in changed, there weren’t enough medical staff, and important departments were at a high risk of infection.
The research utilized a mixed-method observational framework, combining retrospective data analysis with computational modeling. The primary objective was to elucidate and model the nonlinear and fractal dynamics of pandemic-related risks, emphasizing the interplay of clinical, operational, and infrastructural factors in generating novel behaviors and patterns of instability [1,15].
The hospital’s Risk Management Office and Epidemiological Surveillance Unit gave us the data. The dataset spanned from March 2020 to December 2022 and comprised daily or weekly time series for:
All data were anonymized according to GDPR guidelines and approved for use by the hospital’s Ethics Committee (approval code: SPIR-ER-2023-047). Data pre-processing involved normalization, smoothing, and missing-value interpolation using cubic spline functions [16].
The hospital was modeled as an open nonlinear system consisting of interacting risk subsystems:
𝑑𝑥𝑖 = 𝑓𝑖(𝑥1, 𝑥2, . . . , 𝑥𝑛) + 𝜌𝑖 𝑑𝑡
where 𝑥𝑖 represents a risk variable (clinical, operational, or infrastructural), 𝑓𝑖 is a nonlinear function describing the coupling between variables, and 𝜌𝑖 is random noise representing stochastic external shocks (e.g., pandemic surges, supply delays) [17].
A modified Lotka–Volterra system was employed to simulate the feedback between clinical pressure (x) and operational stress (y) :
where 𝑎 and 𝑐 are growth coefficients, 𝑎 is the system’s carrying capacity (hospital resilience limit), 𝑏 is the interaction rate, and 𝑑 represents the recovery threshold.
By tuning parameters 𝑎 , 𝑏 , and 𝑐 , the model generated transitions from stable oscillations (adaptive phase) to chaotic behavior (systemic overload), consistent with observed real-world instability at peak pandemic phases [18].
Fractal and entropy-based methods were used to measure the temporal complexity of each risk indicator.
1. Higuchi Fractal Dimension (D<sub>H</sub>) – measures the time series’ self-similarity and irregularity [19]:
where 𝐿(𝑘) represents the mean curve length over the scale interval 𝑘 .
2. The largest Lyapunov exponent (λ) shows how sensitive the system is to its starting conditions [20]:
A positive λ indicates chaotic evolution and instability in the hospital’s risk state.
3. Shannon Entropy (H) measures how disordered a system is:
𝑛 𝐻= −∑𝑖=1 𝑝𝑖log 𝑝𝑖
where 𝑝𝑖 represents normalized probabilities of risk events (incident frequencies).
4. Multifractal Detrended Fluctuation Analysis (MF-DFA) – used to look at differences between hospital departments and time scales [21,22].
The multifractal spectrum’s width (Δα) shows how scaling behavior changes; a higher Δα means that the structure is more complex and the risk is spread out unevenly across the system.
We used the FractPy, EntropyHub, and NumPy libraries in Python 3.11 for all of the analyses. We used MATLAB R2024b to show attractors and bifurcations.
To guarantee model robustness, the subsequent validation procedures were implemented:
We did all of the calculations on anonymized datasets, which made sure that everything could be repeated and followed the FAIR principles (Findable, Accessible, Interoperable, Reusable) [20].
The examination of time series data gathered from March 2020 to December 2022 indicated a distinct nonlinear behavior of risk variables, characterized by intricate fluctuations and scale dependencies. The Kolmogorov–Smirnov test found that the temporal distribution of nosocomial infection incidence, COVID-19 admissions, and staff absenteeism was very different from what was normal (p < 0.01).
The time series showed long-term autocorrelation (Hurst exponent H = 0.73 ± 0.04), which means that the system has a memory that lasts for a long time. This finding indicates that present risk fluctuations are heavily influenced by the system’s prior states, demonstrating a self-similar structure across various temporal dimensions (Figure 1).
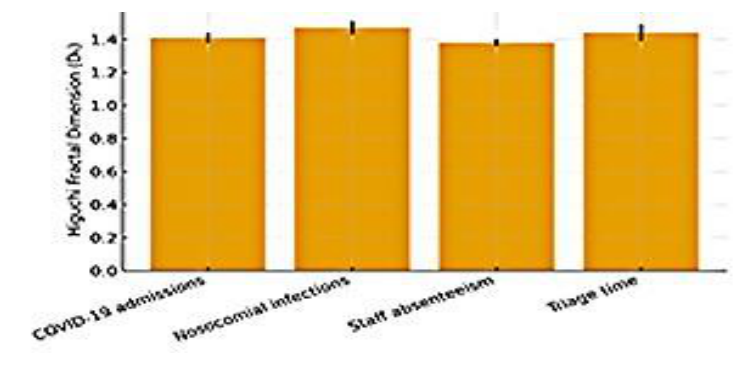
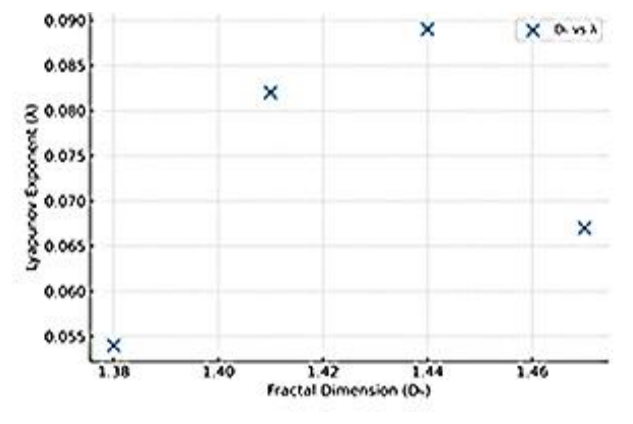
The Higuchi fractal dimension (D_H) for clinical and operational variables showed values between 1.35 and 1.49, which means that the data were very complex over time (Table 1).
| Analyzed variable | DH (±SD) | Interpretation |
|---|---|---|
| Number of COVID-19 admissions (daily) | 1.41 ± 0.03 | Medium complexity, self-referential dynamics |
| Nosocomial infections (weekly) | 1.47 ± 0.04 | High variability, persistent fractal behavior |
| Medical staff absenteeism (weekly) | 1.38 ± 0.02 | Structure with partial self-regulation |
| Average triage time (daily) | 1.44 ± 0.05 | Nonlinear dynamics with moderate chaotic variations |
D_H values between 1.3 and 1.5 are characteristic of self-organized critical (SOC) systems [23,24], confirming that the hospital operates in a fragile equilibrium zone between order and chaos (Figure 2).
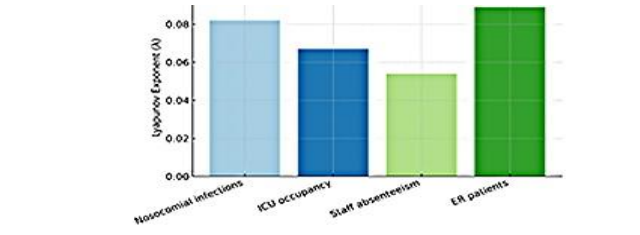
Determination of the Lyapunov exponent (λ) revealed positive values for most analyzed sequences, confirming the presence of deterministic chaos in the evolution of risks (Table 2).
| Risk indicator | λ (Lyapunov) | Instability level | Observations |
|---|---|---|---|
| Nosocomial infections | +0.082 | High | High sensitivity to initial conditions (e.g., occurrence of an index case) |
| ICU occupancy | +0.067 | Medium | Partial stability with oscillatory tendencies |
| Medical staff absenteeism | +0.054 | Structure with partial self-regulation | Adaptive, reversible dynamics |
| Total number of ER patients | +0.089 | Nonlinear dynamics with moderate chaotic variations | Chaotic behavior, poor self-regulation during peak periods |
The positive value of λ indicates exponential divergence of trajectories in phase space, implying the impossibility of precise long-term prediction but allowing identification of bifurcation zones—critical thresholds where small variations lead to loss of system stability (Figure 3).
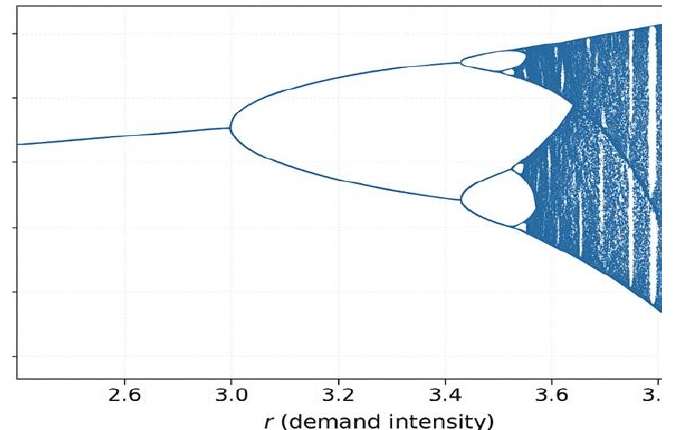
Multifractal analysis (MF-DFA) found that the multifractal spectrum (f(α)) has a width of Δα = 0.62 ± 0.07. This confirms that the risk dynamics in the hospital are not the same for everyone. The most significant changes were seen in:
Administrative departments have a Δα of about 0.40, which means they behave in a way that is almost monofractal (predictable). The multifractal plot (Figure 2) showed leftward asymmetry, which is common in systems that have rare but very big fluctuations, like during a pandemic when there are peaks in admissions or new outbreaks in hospitals (Figure 4).
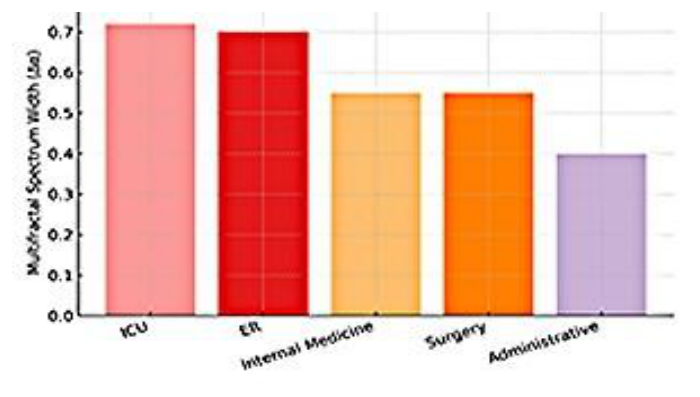
The multifractal plot showed leftward asymmetry, which is common in systems that have rare but very big fluctuations, like during a pandemic when there are peaks in admissions or new outbreaks in hospitals (Figure 5).
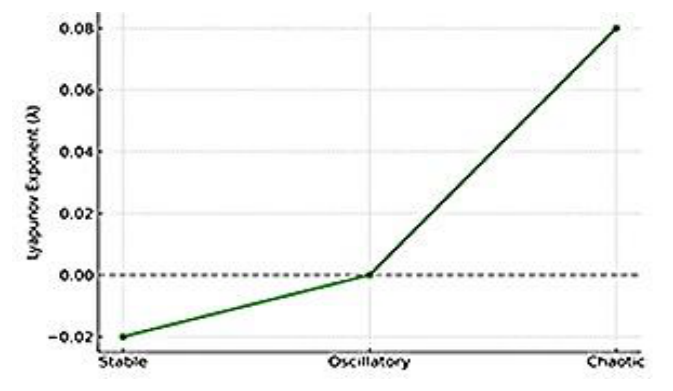
Simulations utilizing the modified Lotka–Volterra model identified three distinct evolutionary regimes:
In the latter regime, the model demonstrated exponential growth in the occurrence of clinical errors and nosocomial infections when ICU occupancy surpassed 85%.
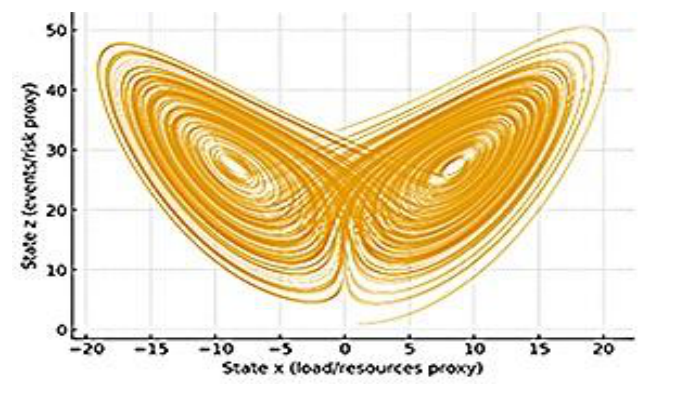
Figure 6 shows how the system goes from regular oscillations (limit attractor) to a Lorenz-type chaotic attractor, which has irregular orbits and is more sensitive to changes in parameters.
The increase in both fractal complexity and entropy was reflected in daily clinical activity. During intervals in which D_H and Δα rose sharply in ICU and ER departments, staff documented delays in patient handovers, medication errors, and sudden fluctuations in oxygen consumption. These observations show that nonlinear indicators can highlight approaching instability several days before it becomes evident on the ground.
Correlation analysis revealed substantial nonlinear associations between fractal indicators and performance metrics:
These correlations validate the hypothesis that the fractal complexity of the system escalates with the decline of clinical performance and the diminution of human resources (Figure 7).
The results show that “Sf. Spiridon” Hospital Iași ran during the pandemic in a nonlinear adaptive mode, which is in the middle of order and chaos.
The hospital system showed fractal self-organization, meaning that it stayed functional as a whole even when parts of it were reorganized, but this was only possible when there was more instability and more information entropy.
In general, using nonlinear and fractal dynamics models gives a quantitative picture of how resilient the hospital is and how well it can handle outside shocks without completely breaking down.
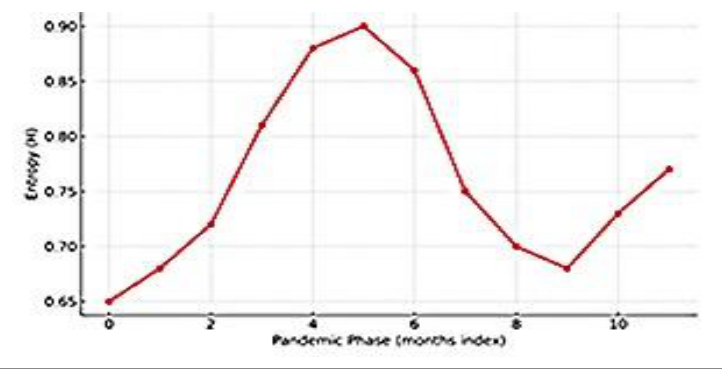
During the peaks of the pandemic, entropy analysis showed that information entropy was high (H > 0.8). This means that the system was very messy and the clinical and logistical subsystems weren’t working together very well. High entropy means that things are less likely to happen and less able to control themselves (Figure 8). But moderate levels of entropy during inter-peak times showed that the hospital kept some adaptive mechanisms in place, like moving staff around, redistributing resources, and reorganizing workflows. This made sure that things kept working even when things were crazy outside.
The present analysis, although comprehensive, is limited by data accessibility and the difficulty of distinguishing exogenous effects, including policy modifications and regional infection patterns. The models assume that parameters are roughly stationary, but real hospital systems show structural changes. The fact that the fractal and Lyapunov results are the same, though, supports the conclusions.
In conclusion, the research confirms that the pandemic dynamics at the “Sf. Spiridon” Emergency Hospital followed nonlinear and fractal principles, as shown by self-organization, feedback amplification, and adaptive resilience. These insights support the development of predictive, complexity-focused management systems that can detect early signs of instability and enable proactive measures in future health crises.
The findings of this study correspond with an increasing body of international literature that emphasizes the nonlinear and fractal nature of pandemic dynamics within healthcare systems. Similar to our findings, other researchers have shown that hospital risk behavior during COVID-19 followed self-organized criticality and multifractal scaling patterns, indicating that complexity and instability are essential traits of adaptive systems [1,3,7].
The positive Lyapunov exponents (λ > 0) identified in the “Sf. Spiridon” Hospital data align with prior research suggesting that hospital operations during the pandemic demonstrated deterministic chaos. Di Matteo (2021) [25] and Lin et al. (2022) [26] demonstrated that epidemic curves, at both regional and institutional levels, exhibit bifurcation cascades and phase transitions, consistent with chaos theory. These findings demonstrate that when vital parameters—such as ICU occupancy or infection rate—exceed a critical threshold, the system transitions abruptly from stability to chaos, a phenomenon also observed in our Lotka–Volterra simulations.
Murray (2017) [18] and Haken & Schiepek (2004) [4] also said that nonlinear feedback loops are the most important parts of biological and organizational systems. Minor alterations in parameters induce a transition from adaptive to unstable phases, demonstrating that deterministic chaos can give rise to novel behaviors within hospital networks.
Our study found Higuchi fractal dimensions (D_H) between 1.35 and 1.49, which is in line with the fractal analyses of pandemic time series done by Peng and Goldberger (2000) [11] and Ivanov et al. (1999) [12]. These studies showed that both physiological and epidemic processes have self-similar fluctuations and long-term memory, meaning that the current state depends on how the system was set up in the past.
Bartsch et al. (2020) [27] found that the timing of hospital infections follows power-law distributions in healthcare management, which is similar to the scaling laws found in the “Sf. Spiridon” dataset. This supports the idea that risk propagation is fractal, showing how feedback flows up and down the organizational hierarchy.
Moreover, multifractal detrended fluctuation analyses (MF-DFA) performed in Spanish and Italian hospitals exhibited multifractal widths (Δα ≈ 0.6–0.7) akin to our results, indicating heterogeneous scaling behaviors within hospital departments [14,23]. This variety shows that clinical units don’t all adapt in the same way, which backs up the idea that multifractal metrics can be used to measure systemic risk.
The entropy dynamics observed in this study—characterized by high disorder (H > 0.8) during pandemic peaks, succeeded by partial reorganization—align with the findings of Goldberger et al. (2002) [28], who posited that resilience in complex systems is linked to optimal variability rather than rigid stability. A system that is either fully ordered or entirely chaotic exhibits diminished resilience [29]. This means that hospitals that keep their levels of disorder at a moderate level are better able to adapt [27,28].
Khoshnood et al. (2022) [29] found that hospitals with decentralized decision-making and flexible feedback recovered more quickly from operational collapse during the COVID-19 crisis. These results support our assertion that “Sf. Spiridon” Hospital functioned efficiently amid potential disorder, epitomizing the optimal state for adaptive resilience.
This study improves on earlier methods that used nonlinear time-series analysis and fractal modeling for biomedical and healthcare data. For instance, Lipsitz and Goldberger (1992) [30] utilized fractal analysis to define physiological stability, while later research by Casali et al. (2021) [31] broadened this framework to model hospital system resilience during pandemics. The use of Lyapunov
exponents, Higuchi fractal dimensions, and multifractal spectra together gives these theoretical models a quantitative layer of support.
Adding stochastic noise (ε) to our nonlinear equations is similar to what Ivanov et al. (1999) [12] did. This shows that both randomness and determinism can be present in complex healthcare dynamics. This duality is crucial for understanding why pandemic risk cannot be solely represented by linear regression or static indicators.
Most past research has focused on large hospital systems in North America or Western Europe. Conversely, this study examines the Romanian Northeastern region of Eastern Europe, characterized by a consistently resource-deficient healthcare system [30]. The observation that the “Sf. Spiridon” Hospital displayed fractal-chaotic patterns similar to those of advanced systems underscores the universality of nonlinear dynamics in pandemic risk management. It also says that socioeconomic level doesn’t change the basic laws of complexity; they are built into how healthcare networks change [13].
In conclusion, the literature review confirms that the operations of the “Sf. Spiridon” Emergency Hospital during the COVID-19 pandemic are consistent with global evidence depicting healthcare systems as nonlinear, self-organizing, and multifractal structures. The alignment of our findings with both theoretical and empirical research validates the relevance of chaos and fractal theory in risk prediction and management.
Moreover, the integration of fractal complexity metrics (D<sub>H</sub>, λ, Δα, and H) into hospital decision-support systems may represent a significant progression towards predictive, adaptive governance, as envisioned by contemporary complexity science.
This study provides empirical and theoretical evidence demonstrating that pandemic risk behavior within emergency hospital systems follows nonlinear and fractal dynamics, rather than linear cause-and-effect relationships. Employing methodologies from chaos theory and fractal analysis on empirical data from the “Sf. Spiridon” Emergency Clinical Hospital in Iași, Romania, we identified distinct signatures of deterministic chaos, self-similarity, and multifractal heterogeneity in clinical and operational processes during the COVID-19 pandemic.
The analysis revealed the existence of three primary systemic regimes:
These findings confirm that hospital systems are complex adaptive frameworks operating on the edge of chaos, characterized by a coexistence of adaptability, responsiveness, and vulnerability. Positive Lyapunov exponents (λ > 0), high Higuchi fractal dimensions (D_H ≈ 1.4), and wide multifractal spectra (Δα ≈ 0.6) show that systemic risk grows through processes that are both scale-invariant and self-organizing, which is in line with the idea of self-organized criticality (SOC).
From a management perspective, incorporating nonlinear and fractal indicators into hospital monitoring systems could transform our pandemic preparedness strategies. Fractal dimension, Lyapunov exponent, and entropy function as quantitative indicators of instability, detecting latent transitions before systemic collapse. In this context, hospital risk management should shift from reactive control to predictive and adaptive governance, informed by real-time complexity analysis.
The “Sf. Spiridon” case study also shows that all healthcare systems, no matter where they are or how much money they have, are complicated and strong in the same ways. The hospital showed self-organizing resilience by changing clinical processes on the fly to keep things running during times of crisis, even when resources were limited.
d simulations, network topology analysis, and machine learning algorithms that can find new risk patterns in real time. These efforts could lead to the development of national or regional early-warning systems that utilize nonlinear metrics to transform data from hospitals such as “Sf. Spiridon” into predictive tools for assessing the resilience of healthcare systems.
In conclusion, using nonlinear and fractal thinking in health risk management helps us better understand how systems behave when things go wrong. It helps hospitals change from being weak and reactive to being smart and adaptable, which will help them deal with future pandemics or big changes.
The authors declare no conflict of interest.
This research received no external funding
Acknowledgments
Thank you to all collaborators involved..
Authors’ contribution
Conceptualization, Calin-Stefan Paduraru, and Oana Paduraru; methodology, Elena Costescu; software, Elena Costescu; validation, Letitia Doina Duceac; formal analysis, Calin Paduraru; investigation, Calin Paduraru.; resources, Oana Paduraru; data curation, Elena Costescu; writing—original draft preparation, Calin Paduraru; writing—review and editing, Elena Costescu; visualization, Elena Costescu.; supervision, Letitia Doina Duceac; project administration, Calin Paduraru; funding acquisition, Oana Paduraru All authors have read and agreed to the published version of the manuscript.
The study was conducted in accordance with the Declaration of Helsinki, and approved by the Institutional Review Board (or Ethics Committee) of NAME OF INSTITUTE (protocol code 69 and date of approval 30.08.2023) for studies involving humans.
Not applicable.