
Hypertensive and diabetic patients are a large population, usually at high or very high cardiovascular risk. In the most recent ESC/EURObservational Research Program (EORP) EUROASPIRE surveys, history of hypertension (HT) was present in more than 80% of patients with known diabetes mellitus (DM) and in more than 74% of persons with newly diagnosed DM and a history of coronary heart disease [1].
Despite progress in terms of treatment options, blood pressure (BP) control remains a current and challenging problem for physicians, patients, and the healthcare system. Blood pressure variability (BPV) is a documented risk factor for cardiovascular diseases, chronic kidney disease, and cognitive decline [2,3]. However, current guidelines do not list BPV as a target in hypertension management, probably because of a lack of consistent thresholds. Based on monitoring time duration, BPV is classified into four types: very-short-term (beat-to-beat), short-term (within 24hours, using Ambulatory Blood Pressure Monitoring – ABPM), medium-term (days), and long-term (months – years). In order to improve individualized patient management, more information is needed, and it could be derived from data we already have. Fractal analysis could offer such data, as temporal series from ABPM are signals that can be analyzed using mathematical models that go beyond conventional parameters such as mean values, standard deviation (SD), or coefficient of variation (CV). Curve convolutedness is an assessment of how BP changes during day and night, and could be improved by BP control.
The aim of the study was to test fractal analysis of ABPM temporal series, beyond conventional BPV parameters, as a measure of BPV and to assess its impact on optimized BP control in patients with HT and type 2 DM.
We conducted a single-center cross-sectional cohort study in consecutive outpatients with HT and type 2 DM who underwent ABPM between March 1st and May 31st 2021, in the Cardiology and Internal Medicine Department of the “Prof. Dr. Th. Burghele” Clinical Hospital in Bucharest.
Study group. The inclusion and exclusion criteria are listed below:
Inclusion criteria:
Exclusion criteria:
Study variables upon inclusion were as follows:
ABPM was performed using the same device (Contec, ABPM50) in all patients, with standard sampling rates (every 15 minutes during the day, every 30 minutes during the night). A CV of 10% was used to separate low from high BPV at ABPM. BP control was defined according to European Guidelines available at the time, with all values from both the office BP and ABPM below recommended thresholds; the guidelines define hypertension for BP 140/90 mmHg for office BP, ≥ 135/85 mmHg for diurnal BP, ≥ 120/70mmHg for nocturnal BP, ≥ 130/80 mmHg for mean 24-h BP [4]. Study data were stored on password-protected computers, and data confidentiality was ensured. All research was conducted in accordance with the Declaration of Helsinki and was approved by the local Ethics Committee.
Fractal analysis. The fractal dimensions (FDs) of the curves generated from ABPM data were calculated using the FracLac plugin for ImageJ, which is available online. FDs were determined separately for systolic blood pressure (SBP), diastolic blood pressure (DBP), pulse pressure (PP), and pulse rate (PR), with daytime and nighttime recordings analyzed independently to account for differences in sampling intervals. The box-counting method was utilized for each temporal series on binary images. Box counting is a sampling process used to calculate FD by systematically laying a series of grids of progressively decreasing caliber (the boxes) over an image of data (the counting) for each successive caliber. Changing the size of the boxes in a grid is the way of approximating scaling in box counting. Fractal dimension is then calculated by using the formula: FD = log(N) / log(r), where FD=fractal dimension, N=number of self-similar pieces in the fractal, r=scaling factor (how much each piece is scaled down versus the original) [5].
Statistical analysis. Univariate analysis was applied to both categorical (expressed as percentages) and numeric variables (expressed as mean +/- standard deviation). Chi-squared and Fisher’s exact tests, and ANOVA or non-parametric (Kruskal-Wallis) tests were applied, respectively. Logistic regression models were used to estimate odds ratios with 95% confidence intervals (p<0.05 was considered significant).
One hundred seventeen patients were included in the study, with a mean age of 62.8±10.3 years; 46.1% were male. The participants were divided into 2 groups: G1 with uncontrolled HT (60 patients, 51.3%) and G2 with controlled HT (57 patients, 48.7%). There were no significant differences between G1 and G2 regarding age, gender, the presence of obesity, complicated diabetes mellitus (DM), the number of DM complications, or antidiabetic treatment. A statistically significant proportion of patients in G2 had controlled DM compared to G1. Treatment with ACE inhibitors, ARBs, CCBs, and beta-blockers did not differ statistically between the two groups, but a statistically significantly higher proportion of patients in G1 were treated with thiazide diuretics and other antihypertensives (centrally active drugs). The study population’s main characteristics are detailed in Table 1.
| Characteristics | G1 (n=60) | G2 (n=57) | Overall (n=117) | p-value |
|---|---|---|---|---|
| Age, years, mean ± standard deviation | 62.3 ± 10.3 | 63.3 ± 10.4 | 62.8 ± 10.3 | 0.61 |
| Male sex, n (%) | 32 (53.3) | 22 (38.6) | 54 (46.1) | 0.1 |
| Smoking (ex- or current), n (%) | 18 (30) | 17 (29.8) | 35 (29.9) | 0.98 |
| Obesity, n (%) | 36 (60) | 28 (49.1) | 64 (54.7) | 0.23 |
| Cardiac disease, n (%) | 30 (50.8) | 26 (47.3) | 56 (47.8) | 0.7 |
| Complicated DM, n (%) | 55 (93.2) | 50 (89) | 105 (89.7) | 0.45 |
| Number of DM complications, mean ± standard deviation | 1.55 ± 1.1 | 1.4 ± 1.1 | 1.47 ± 1.1 | 0.48 |
| Controlled DM | 15 (27.2) | 27 (51.9) | 42 (35.9) | 0.009 |
| Drug Treatment | ||||
| Oral antidiabetics, n (%) | 46 (78) | 39 (70.1) | 85 (72.6) | 0.38 |
| Insulin, n (%) | 11 (18.6) | 9 (16.3) | 20 (17.1) | 0.74 |
| ACEI, n (%) | 30 (50.8) | 20 (36.3) | 50 (42.7) | 0.11 |
| ARB, n (%) | 24 (40.7) | 20 (36.3) | 44 (37.6) | 0.63 |
| CCB, n (%) | 30 (50.8) | 25 (45.4) | 55 (47) | 0.56 |
| BB, n (%) | 40 (67.8) | 37 (67.2) | 77 (67.58) | 0.95 |
| Diuretics, n (%) | 49 (83) | 34 (61.8) | 83 (70.1) | 0.01 |
| Other antihypertensives, n (%) | 12 (20.3) | 2 (3.64) | 14 (12) | 0.01 |
| Statin, n (%) | 38 (64.4) | 42 (76.4) | 80 (68.4) | 0.16 |
| Antiplatelet drugs, n (%) | 28 (47.5) | 26 (46.3) | 54 (47.3) | 0.32 |
| Office BP and Pulse rate | ||||
| Sitting SBP/DBP mmHg, mean ± standard deviation | 149.5/83.6 ± 5.8/14.5 | 135.5/78.3 ± 8.4/8 | 142.7/81.1 ± 13.7/7.6 | 0 |
| Standing SBP/DBP, mmHg, mean ± standard deviation | 148.3/82.2 ± 11.7/7.3 | 133.4/76.7 ± 12.7/8 | 141/79.6 ± 14.3/8.1 | 0.005 |
| Pulse rate, beats/min, mean ± standard deviation | 74.8 ± 9.9 | 71.5 ± 10.3 | 73 ± 10 | 0.08 |
| Laboratory data | ||||
| Blood glucose, mg/dL, mean ± standard deviation | 145.1 ± 34.9 | 127.2 ± 23.1 | 136.4 ± 31 | 0.01 |
| HbA1c, %, mean ± standard deviation | 6.7 ± 1 | 6.2 ± 0.78 | 6.5 ± 0.9 | 0.001 |
| eGFR by MDRD equation, mL/min/1.73 m², mean ± standard deviation | 66.9 ± 28 | 77.5 ± 18.4 | 72.1 ± 24.3 | 0.03 |
| Renal dysfunction (eGFR<60%), n (%) | 28 (51.8) | 11 (23.4) | 39 (33.3) | 0.003 |
| LDL-cholesterol, mg/dL, mean ± standard deviation | 102.5 ± 38 | 92.5 ± 37.6 | 96.9 ± 37.9 | 0.24 |
| Electrocardiographic changes, n (%) | 21 (35) | 21 (36.8) | 42 (35.9) | 0.43 |
| Echocardiography: LVEF %, mean ± standard deviation | 58.3 ± 4.3 | 59.5 ± 5.1 | 59 ± 4.8 | 0.39 |
Abbreviations: G=group, n=number, DM=diabetes mellitus, ACEI=angiotensin-converting enzyme inhibitors, ARB=angiotensin receptor blockers, CCB= calcium channel blockers, BB=beta-blockers, BP=blood pressure, SBP=systolic blood pressure, DBP=diastolic blood pressure, HbA1c=glycated hemoglobin, eGFR=estimate glomerular filtration rate, LDL=low-density lipoprotein, LVEF=left ventricular ejection fraction.
The patients’ comorbidities were respiratory diseases (13 patients, 11.1%), gastrointestinal disorders (40 patients, 34.1%), renal and genitourinary tract diseases (33 patients, 28.2%), osteoarticular changes (46 patients, 39.3%), hyperthyroidism (4 patients, 3.4%), and hypothyroidism (13 patients, 11%). No significant associations were observed between comorbidities and BP control.
Electrocardiographic changes consisted of extrasystole, ST-T changes, and bundle branch blocks. Echocardiography: the mean left ventricular EF was 58.3 ± 4.3%. 30 patients (25.6%) had left ventricular hypertrophy, and 31 patients (26.4%) had mild degenerative aortic and mitral valvular disease.
ABPM data. As controlled BP was defined based on both clinical and ABPM values, these values were expected to differ significantly between the 2 control groups (Tables 1 and 2).
| ABPM data | G1 (n=60) | G2 (n=57) | Overall (n=117) | p-value |
|---|---|---|---|---|
| Mean 24-h SBP/DBP, mmHg, mean ± standard deviation | 132.4/74.8 ± 12/8.8 | 118.5/68.7 ± 8.2/7.1 | 125.7/71.8 ± 12.5/8.5 | 0 |
| Mean diurnal SBP/DBP, mmHg, mean ± standard deviation | 133.5/75.7 ± 11.9/8.8 | 120.6/70.3 ± 8.1/7.1 | 127.2/73.1 ± 12.1/8.4 | 0 |
| Mean nocturnal SBP/DBP, mmHg, mean ± standard deviation | 127/70.7 ± 16.1/11.5 | 109.7/60.8 ± 12/8.7 | 118.7/66 ± 16.6/9.4 | 0 |
| Dipping, %, mean ± standard deviation | 4.9 ± 8.7 | 9.6 ± 7.4 | 7.1 ± 8.4 | 0.002 |
| High blood pressure variability (CV) n (%) | 46 (76.7) | 39 (68.4) | 85 (72.6) | 0.31 |
| Fractal analysis | ||||
| FDs SBP diurnal, mean ± standard deviation | 1.229 ± 0.034 | 1.2431 ± 0.0341 | 1.2358 ± 0.0347 | 0.02 |
| FDs SBP nocturnal, mean ± standard deviation | 1.123 ± 0.024 | 1.1241 ± 0.0248 | 1.1228 ± 0.0239 | 0.6 |
| FDs DBP diurnal, mean ± standard deviation | 1.2419 ± 0.0354 | 1.2422 ± 0.0345 | 1.2421 ± 0.0331 | 0.12 |
| FDs DBP nocturnal, mean ± standard deviation | 1.2487 ± 0.2987 | 1.2491 ± 0.0391 | 1.2489 ± 0.0395 | 0.09 |
| FDs PR diurnal, mean ± standard deviation | 1.2241 ± 0.0364 | 1.2246 ± 0.0379 | 1.2243 ± 0.037 | 0.37 |
| FDs PR nocturnal, mean ± standard deviation | 1.1219 ± 0.0345 | 1.1222 ± 0.0254 | 1.122 ± 0.0291 | 0.23 |
| FDs PP diurnal, mean ± standard deviation | 1.28 ± 0.04 | 1.3 ± 0.05 | 1.2962 ± 0.0466 | 0.03 |
| FDs PP nocturnal, mean ± standard deviation | 1.1228 ± 0.0217 | 1.123 ± 0.0221 | 1.1229 ± 0.0219 | 0.4 |
Abbreviations: ABPM=ambulatory blood pressure monitoring, G=group, n=number, FD=fractal dimension, CV=coefficient of variation, PR=pulse rate, PP=pulse pressure.
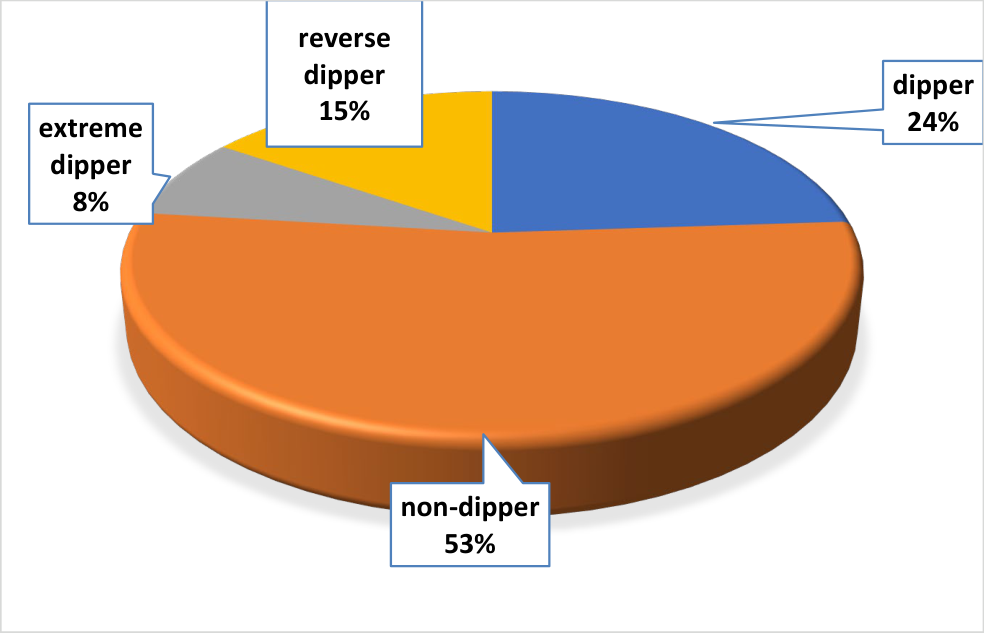
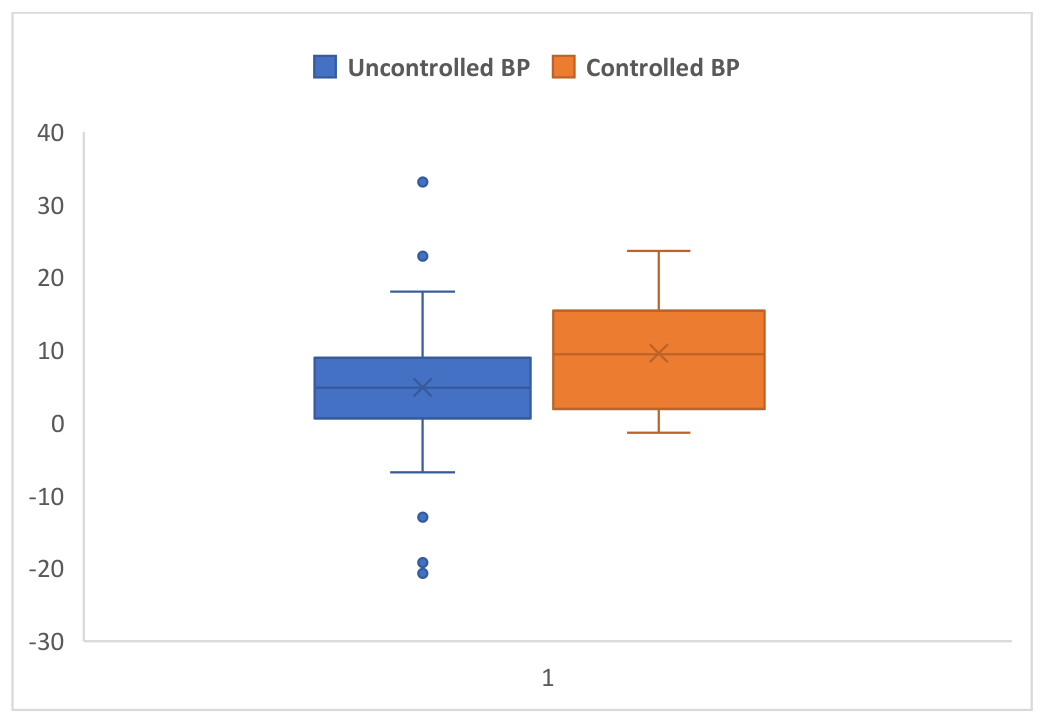
Figure 1 illustrates the distribution of nighttime blood pressure (BP) dipping patterns within the study population. 53 % of patients were non-dippers, 15% were reverse dippers, 24% were dippers, and 8% were reverse dippers. Patients in G2 had a greater decrease in nocturnal SBP (9.6% ± 7.4) than patients in G1 (4.9 ± 8.7, p < 0.002) (Figure 2).
Abbreviations: BP=blood pressure.
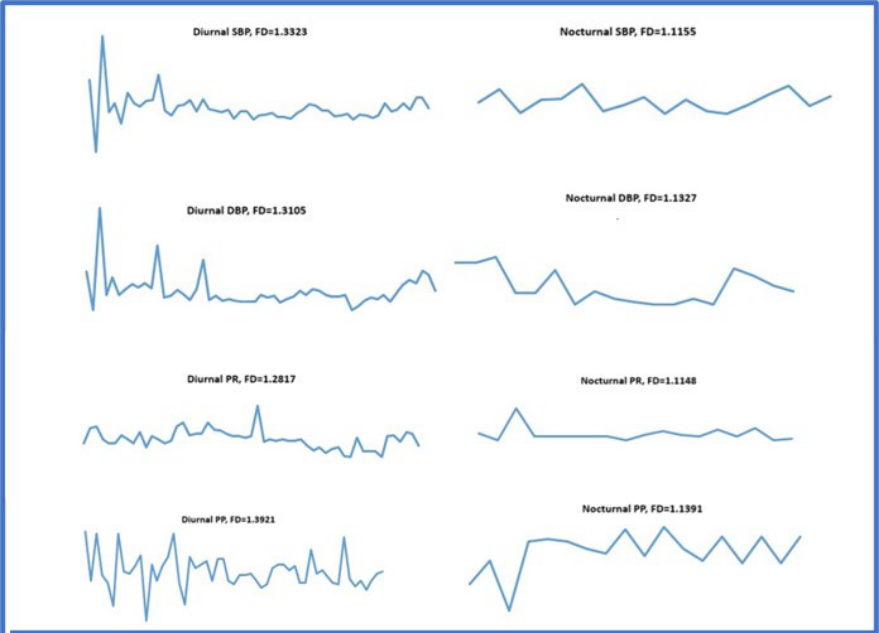
Parameters analyzed using daytime recordings (07:00–22:00; 59 valid measurements) and nighttime recordings (22:00–07:00; 18 valid measurements) were: SBP, DBP, PR and PP. The resulting 10 curves were subsequently analyzed using the box-counting method to estimate FD. Abbreviations: FD=fractal dimension, ABPM=ambulatory blood pressure monitoring, SBP=systolic blood pressure, DBP=diastolic blood pressure, PR=pulse rate, PP=pulse pressure.
A CV >10% was observed in 85 patients (72.6%): 46 patients (76.7%) in G1 and 39 patients (68.4%) in G2, with no statistically significant difference between the groups. By univariate analysis, BP control showed significant associations with blood glucose, HbA1c, and controlled DM; with eGFR by the MDRD equation and renal dysfunction; and with treatment with diuretics and centrally acting drugs.
Fractal dimension. The FDs of the curves derived from the recorded time series reflect the complexity of the corresponding signals, providing information that complements the conventional ABPM parameters. The FD values for SBP, DBP, PR and PP during day and night in the study group and between the G1 and G2 are shown in Table 2.
Figure 3 illustrates the estimation of FD from time series recorded from ABPM in one patient. FD was calculated using the ImageJ/FracLac plugin software, applying the box-counting algorithm to the corresponding curves generated from ABPM monitoring data.
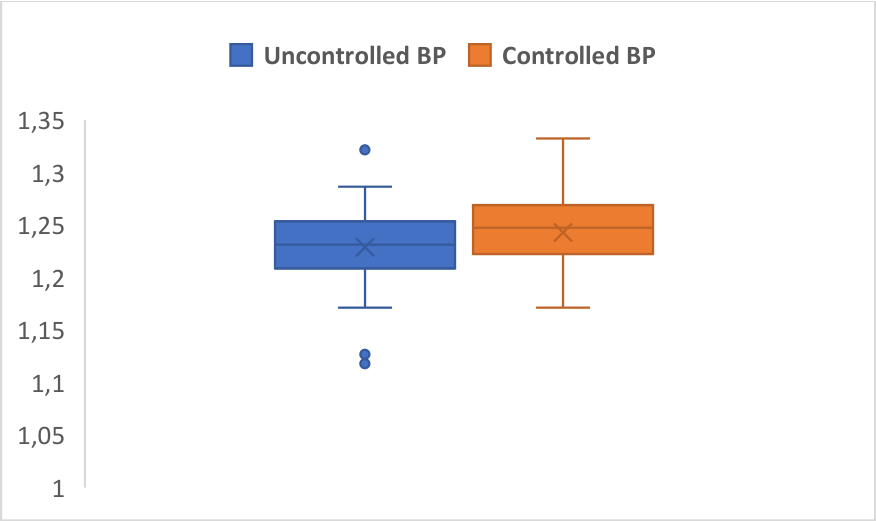
Figure 4 shows the albeit small but significant (p=0.02) difference in mean diurnal SBP FD values between the 2 groups: BP control (1.229 ± 0.03 in uncontrolled BP patients versus 1.2431 ± 0.03 in those with controlled BP).
Abbreviations: BP=blood pressure.
Apart from BP control, FD for diurnal SBP showed significant associations with the presence of DM complications (p=0.005) and with the use of ACEI (p=0.01), diuretics (p=0.04), and centrally acting drugs (p=0.04).
All in all, logistic regression documented the use of diuretics (p=0.04, OR=0.19, 95% CI 0.04-0.89), FD for diurnal SBP (p=0.03, OR=0.03, 95% CI=0.02-0.06), night-time dipping percentage (p=0.006, OR=1.1, 95% CI=1.02-1.16), and the presence of renal dysfunction (p=0.01, OR=0.03, 95% CI 0.002-0.4) as independent predictors for BP control.
In an attempt to identify new parameters for BPV assessment—offering additional information beyond that provided by global indices—the FDs were estimated for all-time series recorded during ABPM. This approach evaluates the complexity of the resulting curves rather than merely amplitude variations. The FDs could provide data that are lost when using global indices, and FD estimation algorithms allow for the use of the limited time series characteristic of ABPM [6-8]. The differing ABPM measurement intervals—every 15 minutes during the day and every 30 minutes at night—required separate calculation of the FD for daytime and nighttime recordings. FDs were estimated consistently across all patients by converting ABPM data into curves and analyzing them using specialized software. In the future, this process could be readily automated or integrated directly into ABPM software through dedicated fractal-analysis algorithms. This method has not been systematically applied to patients with diabetes and HT, except in studies analyzing cutaneous blood flow in relation to HT and diabetic retinopathy. Its application may improve our understanding of cardiovascular dynamics in this population and enable a more comprehensive, individualized assessment using rapid analytical methods [9,10].
Although BP control was not significantly associated with BPV by ABPM CV in this study, it was independently related to the FD of the diurnal SBP, with a slightly more convoluted curve in patients with controlled BP, perhaps suggesting greater adaptability. These findings indicate that CV and FDs capture distinct, complementary characteristics of the time series. Moreover, FDs were generally substantially lower than those previously reported in normotensive individuals, suggesting that reduced signal complexity may characterize systems at risk of, or already affected by, disease, similar to the established association between reduced heart rate variability and coronary artery disease risk. [11]. This explains the association of FDs with BP control, likely due to cardiovascular mechanisms of diurnal BP autoregulation that global BPV parameters fail to capture [12]. There were no significant associations in this study between comorbidities and BP control, but acutely decompensated patients were excluded from the population in order to avoid any interference with BPV that could act as a confounding factor [13-16].
FD estimates obtained using optimized and standard algorithms may provide further insights into this alternative measure of BPV. Moreover, applying other mathematical approaches, through specialized algorithms, could enhance the informational value of BPV analysis.
The limits of the study consist of the relatively small sample size, and the results could benefit from a larger study involving repeated ABPM recordings, offering a better view on pattern reproducibility and further insight on BP control.
Optimal BP and glycemic control remain challenging in patients with HT and DM, underscoring the need for novel assessment methods alongside improved therapeutic strategies and treatment adherence. Fractal analysis may complement conventional parameters by extracting additional clinically relevant information from routinely collected data.
The authors declare no conflict of interest. This research received no external funding.
Conceptualization, A.M.I., and I.P.; methodology, I.P., and A.M.I.; software, B.M.P.; validation, A.M.I., A.M.B., B.M.P., C.N., and I.P..; formal analysis, I.P.; investigation, I.P, and M.G.; resources, I.P., A.M.I, C.N, and C.C.; data curation, I.P.; writing—original draft preparation, I.P., and A.M.I.; writing—review and editing, A.M.I., and I.P.; visualization, B.M.P.; supervision, A.M.I.; project administration, A.M.I., A.M.B, M.G., and I.P. All authors have read and agreed to the published version of the manuscript.
The study was conducted in accordance with the Declaration of Helsinki and approved by the Ethics Committee of “Prof. Dr. Th. Burghele” Clinical Hospital, 050653 Bucharest, Romania ( 11202/16.11.2017).
Informed consent was obtained from all subjects involved in the study.