
Ki-67 indicates tumor proliferative activity and, in breast carcinoma, is interpreted alongside histological grade, hormone receptor (HR) status, HER2 status, and other clinicopathological data. Higher Ki-67 levels are associated with more aggressive tumors and may contribute to prognostic assessment and characterization of the tumor phenotype, particularly in hormone receptor-positive, HER2-negative cancers [1]. Tumor size and estrogen receptor status have also been investigated as correlates of additional axillary nodal involvement in patients with a positive sentinel lymph node [2].
Ki-67 is affected by preanalytical variability, intratumoral heterogeneity, cutoff selection, and interobserver and interlaboratory variability. The International Ki67 in Breast Cancer Working Group recommends standardized assessment and cautious interpretation, particularly for intermediate values [1].
Hybrid [18F]FDG PET/CT imaging assesses tumor metabolism and contributes to breast cancer staging. Its sensitivity and specificity vary with tumor size; in subcentimeter lesions, sensitivity is below 50% because of limited spatial resolution [3,4]. Safety considerations related to radiopharmaceuticals in nuclear medicine have also been reviewed [5].
Prior studies link FDG uptake with proliferation. A meta-analysis of 32 PET studies in breast cancer, including 25 using [18F]FDG, identified a moderate positive association between SUVmax and Ki-67 in the FDG subgroup [6]. Another meta-analysis confirmed that [18F]FDG uptake varies with hormone receptor expression, HER2 status, Ki-67, and tumor subtype [7].
Radiomics is an advanced method of medical image analysis that converts images into quantitative data intended to characterize the tumor phenotype and underlying pathophysiological processes [8,9]. Radiomic descriptors include tumor intensity, shape, volume, and heterogeneity, with potential diagnostic and predictive applications [10]. [18F]FDG PET/CT radiomics has been investigated in relation to histopathological features, treatment response, hormone receptor status, and Ki-67 [11–13]. Interpretation of these features requires comparison with conventional PET parameters: maximum and mean standardized uptake values (SUVmax and SUVmean), metabolic tumor volume (MTV), and total lesion glycolysis (TLG).
Soussan et al. [14], Groheux et al. [15], and Lemarignier et al. [16] evaluated relationships between PET texture and histopathological or immunohistochemical characteristics, with variable findings and an important contribution of tumor volume. Moscoso et al. [17] reported associations on dedicated breast PET images, whereas Aide et al. [18] demonstrated the influence of reconstruction on tumor characterization. Other approaches, such as the pilot study by Li et al., integrated radiomic and clinical features to predict Ki67 [19].
The literature shows substantial variation in methods for feature filtering and dimensionality reduction. Some studies include reproducibility-based filtering [20], univariate filtering, removal of correlated variables, or penalized selection within the same cohort in which the clinical endpoint is analyzed [12,13,19].
These filtering strategies are subsequently used to develop radiomic models, but the results depend on the selection process and characteristics of the study cohort. Radiomic feature values also vary with segmentation, reconstruction, voxel size, and intensity discretization, making reproducibility assessment necessary before biological interpretation. To standardize reporting, the Image Biomarker Standardization Initiative (IBSI) provides standardized definitions of radiomic features [21], while the CLEAR guideline recommends explicit reporting of the radiomics workflow and the sequence of feature selection steps [22].
A systematic review of the literature suggests considerable variation in the intraclass correlation coefficient thresholds used to define stable features [23]. Technical stability is therefore necessary for subsequent biological analysis, but does not establish biological relevance [24].
In our previous study of the same cohort of 42 women, we assessed the interobserver reproducibility of 107 original radiomic features extracted from [18F]FDG PET/CT images. Ninety features had an intraclass correlation coefficient of at least 0.75. Subsequent removal of redundancy based on Spearman correlations reduced this set to 19 features that met the technical selection criteria [20].
The present study aimed to evaluate the association between this set of 19 radiomic features and Ki-67 in untreated primary breast carcinoma, in the context of conventional PET parameters. Ki-67 was analyzed as a continuous variable in the primary analysis and using a 30% cutoff in a secondary comparison. This study is a secondary analysis of the previously published cohort [20].
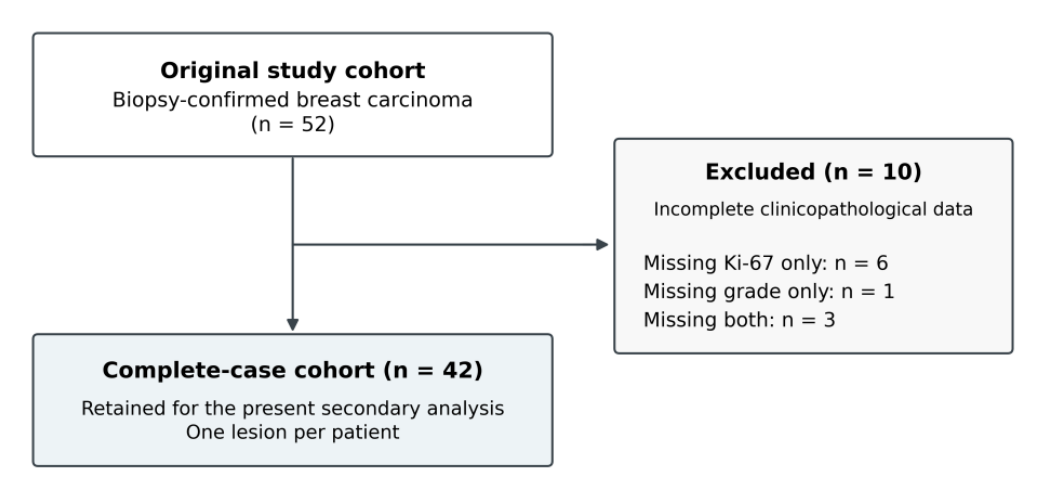
This retrospective, single-center observational study included the same cohort of patients as the previous interobserver reproducibility study [20]. Patients underwent PET/CT at the Dr. Carol Davila Central Military Emergency University Hospital, Bucharest, Romania, between 1 January 2022 and 15 March 2026. The initial cohort comprised 52 women with biopsy-confirmed primary breast carcinoma. Availability of both Ki-67 and histological grade was required when the original cohort was assembled to provide complete clinicopathological data for subsequent analyses. Ten women were excluded because of incomplete clinicopathological data: six lacked Ki-67 only, one lacked histological grade only, and three lacked both. The resulting cohort of 42 women was retained for the present secondary analysis (Figure 1). Feature selection was based exclusively on reproducibility and redundancy, independently of Ki-67 values [20].
The inclusion criteria were biopsy-confirmed primary breast carcinoma, a primary breast lesion visible on [18F]FDG PET/CT, and PET/CT performed before surgery, systemic therapy, or radiotherapy. Patients were excluded if they had received endocrine therapy or chemotherapy before PET/CT, if the lesion had previously been operated on (other than biopsy), if the primary tumor could not be delineated on PET/CT, or if image quality was inadequate. One lesion was analyzed per patient. In multifocal or multicentric disease, the dominant lesion was defined as the largest lesion and/or the lesion with the highest FDG uptake. Confluent foci without a clear boundary were segmented as a single lesion complex. In the single case of bilateral lesions, the metabolically dominant lesion was selected [20].
Ki-67 was obtained from the biopsy pathology report and recorded as a percentage. Hormone receptor and HER2 status were obtained from the same reports.
A Ki-67 cutoff of 30% was used for an exploratory secondary comparison between groups with higher (≥30%) and lower proliferation (<30%). This cutoff is consistent with the recommendations of the International Ki67 in Breast Cancer Working Group, which supports the prognostic use of extreme values (≤5% and ≥30%) in specific clinical contexts [1]. The cutoff was not used in radiomic feature selection.
Informed consent was obtained from all participants. The study was approved by the Local Ethics Committee (approval no. 763) and conducted in accordance with the Declaration of Helsinki. PET/CT examinations were performed as part of routine clinical care. The analysis retrospectively used data from the previously published cohort [20].
All patients were imaged on the same PET/CT scanner, a Discovery MI Digital Ready PET/CT system (GE HealthCare, Waukesha, WI, USA), using the same imaging and preparation protocol. Patients were instructed to follow a low-carbohydrate diet for 24 h and to fast for at least 6 h, with water permitted. Capillary blood glucose was measured before radiotracer administration; the maximum accepted value was 200 mg/dL. [18F]FDG was administered at 2.5 MBq/kg. Image acquisition began 60 ± 10 min after injection, with patients supine and their arms raised above the head, using a whole-body acquisition protocol from the vertex or tentorium to the upper third of the thighs. PET reconstruction used ordered-subset expectation maximization (OSEM) with GE VUE Point FX and SharpIR, including time-of-flight (TOF) and point-spread-function modeling, a 256 × 256 matrix, and native voxel dimensions of 2.734 × 2.734 × 3.269 mm. Intensities expressed in Bq/mL were converted to body-weight-normalized SUV, as described in the previous article [20].
Breast lesions were independently segmented by two nuclear medicine physicians [20] using 3D Slicer version 5.10.0 (Slicer Community, Boston, MA, USA) [25]. An initial mask was generated using automatic Otsu thresholding [26], applied to the PET volume without a preselected local region. The mask was then manually corrected using the attenuation-corrected CT as an anatomical reference [20]. Regional lymph nodes, physiological uptake, and uptake outside the lesion were excluded. The observers were blinded to each other’s segmentation and to the histopathological and immunohistochemical findings [20].
Radiomic features were extracted using PyRadiomics version 3.1.0 (AIM-Harvard, Boston, MA, USA) [27], with original images, a fixed discretization bin width of 0.25 SUV, and the native PET grid. This was the reference configuration in the previous study. No wavelet or Laplacian-of-Gaussian filters were applied, and no isotropic resampling was performed. Feature definitions follow the PyRadiomics implementation, which differs from the IBSI reference standard in documented respects [21,28].
For the PET analysis, SUVmax and SUVmean represented the maximum and mean uptake within the lesion, normalized to body weight. MTV was calculated from the manually corrected Otsu mask aligned to the PET grid, and TLG was calculated as SUVmean × MTV for each observer before averaging. The descriptive volume in Table 1 was derived from the original masks, as in the previous article [20].
Our previous analysis yielded a final panel of 19 radiomic features selected on technical grounds, based on interobserver reproducibility and redundancy reduction [20]. This predefined panel was used unchanged in the present study; no feature was added or removed on the basis of its relationship with Ki-67.
The redundancy filter included radiomic features only.
Analyses used the mean of the two observers’ measurements for each patient. Continuous variables were summarized as the median, interquartile range, and minimum–maximum range. Spearman correlation was used to assess the associations of continuous Ki-67 with the 19 radiomic features and with SUVmax, SUVmean, MTV, and TLG, as well as the relationships between radiomic features and conventional parameters. Two-sided p-values were estimated using 99,999 permutations, and 95% confidence intervals (CIs) were obtained from 2000 patient-level bootstrap samples. Benjamini–Hochberg false discovery rate (FDR) correction was applied separately to the 19 radiomic tests and the four conventional tests, with q < 0.05 indicating statistical significance.
Sensitivity analyses included rank-based partial correlations adjusted for MTV, SUVmax, or both, and repetition of the continuous analysis after exclusion of lesions with a mean native voxel count across observers <100, corresponding to approximately 2.44 cm³ on the native PET grid. The continuous analysis was also repeated separately for each observer. In the secondary comparison of Ki-67 ≥30% versus <30%, effect size was expressed as the rank-biserial correlation (RBC), derived from the Mann–Whitney U statistic. Two-sided p values were estimated by permuting group membership while preserving group sizes. CIs were obtained by non-stratified patient-level bootstrap resampling. Sensitivity and binary analyses were exploratory. FDR correction was applied within each analysis and observer, retaining the families of 19 radiomic tests and four conventional tests. Analyses were performed in Python 3.12.14.
The final cohort included 42 patients. The median age was 68 years (interquartile range, 50.5–73.5; range, 36–84), the median maximum tumor diameter was 25 mm (16–38; 8–100), and the median segmented tumor volume, averaged across the two observers, was 10.629 cm³ (5.111–23.287; 0.793–220.073).
The median Ki-67 value was 35% (15–57.5; 2–80); 22 patients had Ki-67 ≥30% and 20 had Ki-67 <30%. Tumor grade was G1 in 5 patients, G2 in 27, and G3 in 10. Hormone receptors were positive in 36 patients, HER2 was positive in 8, and invasive carcinoma of no special type was present in 37 (Table 1).
| Characteristic | Value |
|---|---|
| Sex | Female, 42 (100%) |
| Age, years | 68 (50.5–73.5; 36–84) |
| Maximum tumor diameter, mm | 25 (16–38; 8–100) |
| Segmented tumor volume, mean across observers, cm³ | 10.629 (5.111–23.287; 0.793–220.073) |
| Lesions with mean native voxels <100 | 6 (14.3%) |
| Ki-67, % | 35 (15–57.5; 2–80) |
| Ki-67 ≥30% | 22 (52.4%) |
| Tumor grade, G1/G2/G3 | 5 / 27 / 10 |
| ER-positive | 35 (83.3%) |
| PR-positive | 28 (66.7%) |
| Hormone receptor-positive | 36 (85.7%) |
| HER2-positive | 8 (19.0%) |
| Invasive carcinoma of no special type | 37 (88.1%) |
Continuous variables are reported as median (interquartile range; range), and categorical variables as number (percentage). The segmented volume was measured from the original masks and averaged across observers, as in the previous study [20].
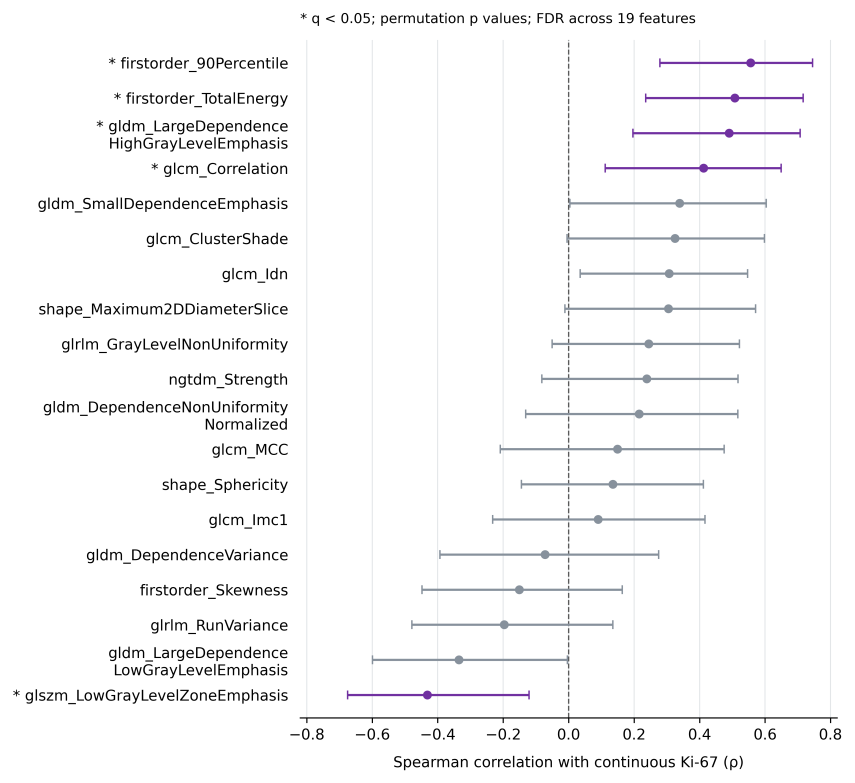
Of the 19 predefined features, five correlated with continuous Ki-67 after FDR correction (Table 2 and Figure 2). The remaining 14 features did not meet the q < 0.05 criterion.
firstorder_90Percentile showed the strongest positive association. Positive correlations were also observed for firstorder_TotalEnergy, gldm_LargeDependenceHighGrayLevelEmphasis, and glcm_Correlation. glszm_LowGrayLevelZoneEmphasis correlated inversely with Ki-67.
| Feature / parameter | Spearman ρ | 95% CI | p | q |
|---|---|---|---|---|
| firstorder_90Percentile | 0.556 | [0.279; 0.745] | <0.001 | 0.002 |
| firstorder_TotalEnergy | 0.507 | [0.236; 0.717] | <0.001 | 0.007 |
| gldm_LargeDependenceHighGrayLevelEmphasis | 0.490 | [0.196; 0.707] | 0.001 | 0.008 |
| glszm_LowGrayLevelZoneEmphasis | −0.432 | [−0.675; −0.121] | 0.005 | 0.022 |
| glcm_Correlation | 0.412 | [0.112; 0.649] | 0.007 | 0.026 |
| SUVmax | 0.565 | [0.302; 0.750] | <0.001 | <0.001 |
| SUVmean | 0.562 | [0.310; 0.754] | <0.001 | <0.001 |
| MTV | 0.442 | [0.160; 0.662] | 0.004 | 0.004 |
| TLG | 0.479 | [0.198; 0.690] | 0.002 | 0.002 |
CI: 95% bootstrap confidence interval, unadjusted for multiple testing. p values were obtained from two-sided permutation tests. FDR correction was applied separately to the 19 radiomic features and the four PET parameters.
<!– Start of picture text –>
Points represent Spearman correlation coefficients (ρ), and horizontal bars indicate 95% bootstrap CIs, unadjusted for multiple testing. The dashed line marks ρ = 0. An asterisk (*) and purple coloring indicate q < 0.05 after Benjamini–Hochberg correction for the 19 tests. Statistical significance is defined by q, not by whether an individual CI excludes zero.
All four conventional PET parameters correlated positively with continuous Ki-67, with associations remaining significant after FDR correction (Table 2). SUVmax and SUVmean had the highest Spearman coefficients, at 0.565 and 0.562, respectively.
The radiomic features associated with Ki-67 also correlated with conventional PET parameters (Figure 3). firstorder_90Percentile correlated with SUVmax at ρ = 0.983 and with SUVmean at ρ = 0.943, whereas firstorder_TotalEnergy correlated with MTV at ρ = 0.948 and with TLG at ρ = 0.988. The SUVmax–MTV correlation was ρ = 0.766.
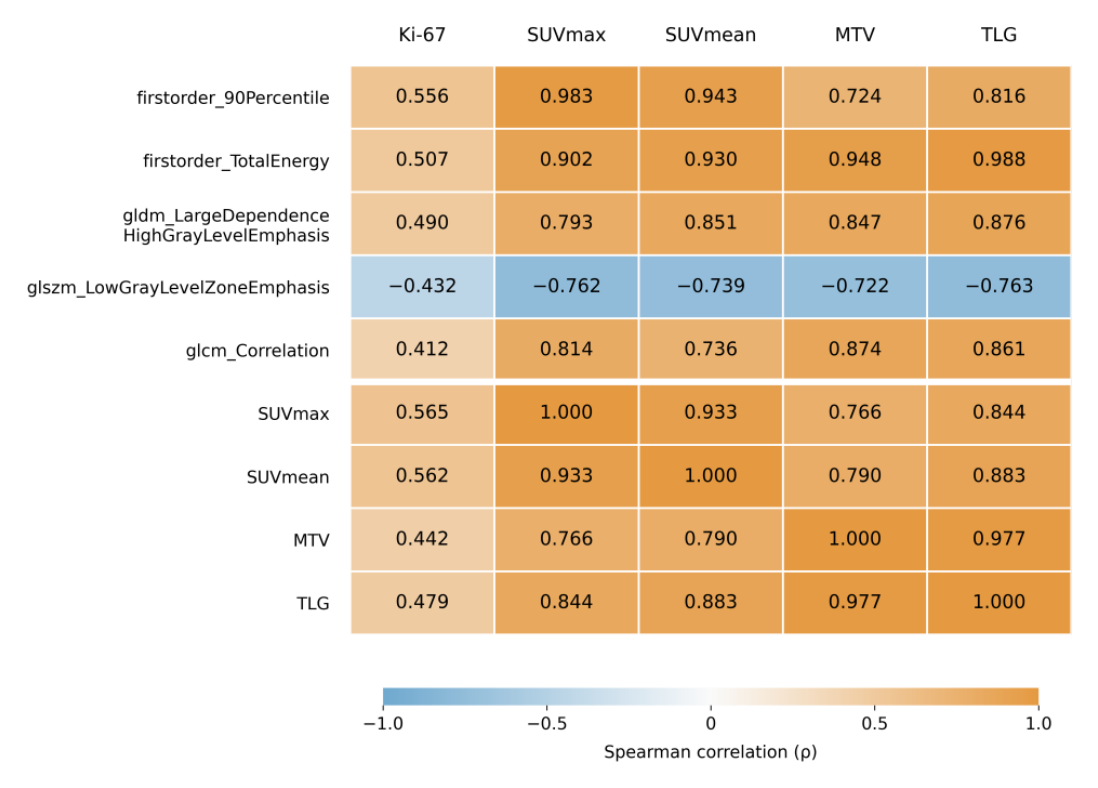
Columns show Ki-67 and the conventional PET parameters. Rows show the five selected radiomic features followed by SUVmax, SUVmean, MTV, and TLG. Cell values are Spearman correlation coefficients (ρ).
In the secondary comparison of Ki-67 ≥30% versus <30%, six radiomic features met the FDR criterion, four of which were also significant in the continuous analysis. All four conventional PET parameters differed between groups after FDR correction.
None of the five features associated with continuous Ki-67 remained significant after adjustment for MTV, SUVmax, or both and FDR correction (Table 3). Across the full 19-feature panel, shape_Sphericity met the FDR criterion only after adjustment for MTV (partial ρ = 0.481; 95% CI, 0.176–0.719; q = 0.030), but not in the unadjusted analysis or after adjustment for SUVmax or both. Exclusion of the six lesions with a mean native voxel count <100 reduced the sample to 36 patients, including 22 with Ki-67 ≥30% and 14 with Ki-67 <30%. All six excluded lesions belonged to the Ki-67 <30% group. The coefficients decreased similarly for SUVmax (ρ = 0.440) and firstorder_90Percentile (ρ = 0.427). No radiomic feature met the FDR criterion in this subset (Figure 4). In the observer-specific continuous analyses, four of the five main associations remained significant for both observers.
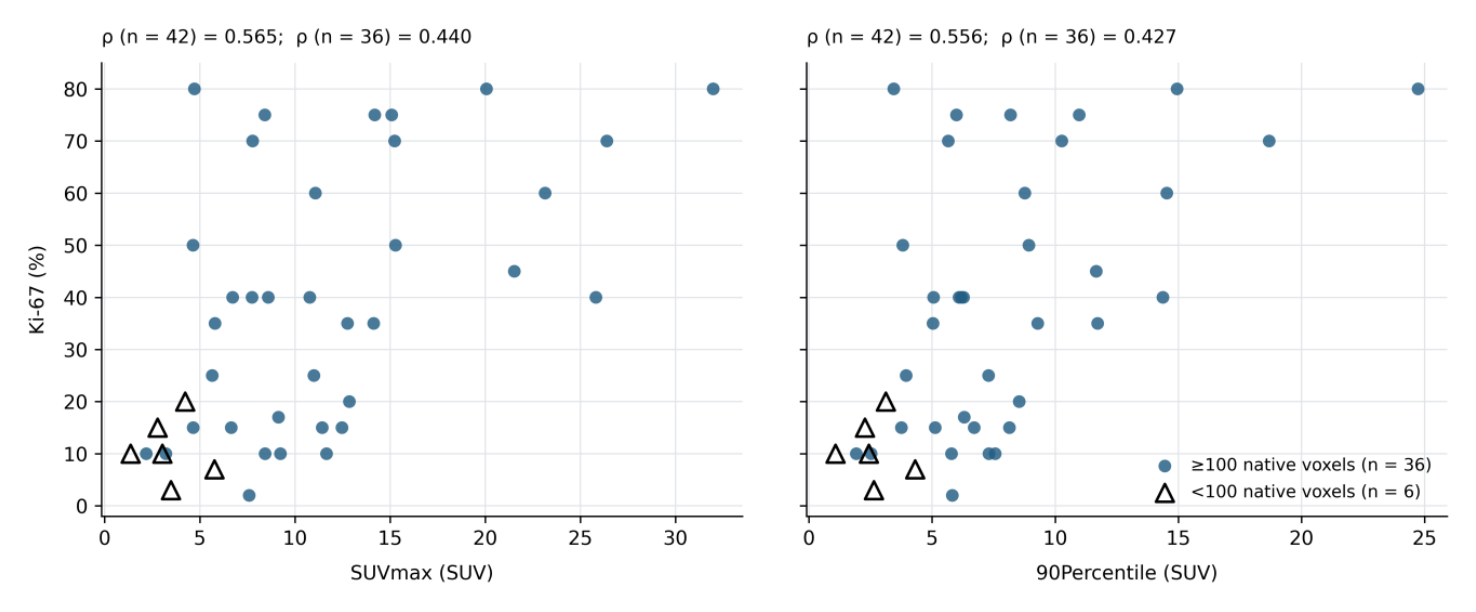
Triangles represent the six lesions with a mean native voxel count <100. Circles represent the remaining 36 lesions. Coefficients were calculated separately for the full cohort (n = 42) and the subset excluding small lesions (n = 36).
| Feature | Adjusted for MTV | Adjusted for SUVmax | Adjusted for MTV + SUVmax |
|---|---|---|---|
| firstorder_TotalEnergy | 0.310 [−0.013; 0.594] p = 0.047; q = 0.230 | −0.007 [−0.271; 0.321] p = 0.967; q = 0.992 | −0.058 [−0.347; 0.382] p = 0.722; q = 0.914 |
| firstorder_90Percentile | 0.382 [0.064; 0.631] p = 0.013; q = 0.126 | 0.003 [−0.318; 0.375] p = 0.987; q = 0.992 | 0.007 [−0.312; 0.379] p = 0.966; q = 0.980 |
| glcm_ClusterShade | 0.185 [−0.164; 0.504] p = 0.247; q = 0.445 | −0.100 [−0.355; 0.271] p = 0.532; q = 0.843 | −0.100 [−0.359; 0.279] p = 0.541; q = 0.808 |
| glrlm_GrayLevelNonUniformity | −0.253 [−0.543; 0.158] p = 0.109; q = 0.399 | 0.048 [−0.236; 0.344] p = 0.767; q = 0.992 | 0.086 [−0.309; 0.411] p = 0.595; q = 0.808 |
| ngtdm_Strength | 0.200 [−0.125; 0.497] p = 0.208; q = 0.445 | −0.215 [−0.457; 0.077] p = 0.177; q = 0.820 | −0.310 [−0.536; 0.060] p = 0.051; q = 0.334 |
| shape_Maximum2DDiameterSlice | −0.310 [−0.547; 0.013] p = 0.048; q = 0.230 | −0.105 [−0.375; 0.194] p = 0.514; q = 0.843 | −0.247 [−0.500; 0.046] p = 0.127; q = 0.481 |
| glcm_Imc1 | −0.141 [−0.445; 0.209] p = 0.378; q = 0.599 | 0.175 [−0.128; 0.466] p = 0.271; q = 0.820 | 0.289 [−0.065; 0.549] p = 0.070; q = 0.334 |
| shape_Sphericity | 0.481 [0.176; 0.719] p = 0.002; q = 0.030 | 0.226 [−0.062; 0.510] p = 0.155; q = 0.820 | 0.339 [0.035; 0.618] p = 0.031; q = 0.334 |
| glcm_Idn | −0.084 [−0.368; 0.235] p = 0.603; q = 0.674 | 0.028 [−0.242; 0.320] p = 0.861; q = 0.992 | 0.024 [−0.299; 0.321] p = 0.885; q = 0.980 |
| glcm_Correlation | 0.060 [−0.313; 0.427] p = 0.708; q = 0.708 | −0.100 [−0.311; 0.184] p = 0.532; q = 0.843 | −0.150 [−0.409; 0.181] p = 0.356; q = 0.615 |
| gldm_DependenceVariance | −0.086 [−0.391; 0.245] p = 0.589; q = 0.674 | 0.150 [−0.167; 0.418] p = 0.348; q = 0.820 | 0.159 [−0.133; 0.408] p = 0.326; q = 0.615 |
| gldm_SmallDependenceEmphasis | 0.195 [−0.140; 0.504] p = 0.219; q = 0.445 | −0.257 [−0.523; 0.093] p = 0.105; q = 0.820 | −0.307 [−0.570; 0.119] p = 0.054; q = 0.334 |
| glszm_LowGrayLevelZoneEmphasis | −0.181 [−0.493; 0.184] p = 0.257; q = 0.445 | −0.002 [−0.327; 0.348] p = 0.992; q = 0.992 | 0.004 [−0.348; 0.408] p = 0.980; q = 0.980 |
| gldm_LargeDependenceLowGrayLevelEmphasis | −0.133 [−0.469; 0.241] p = 0.410; q = 0.599 | −0.017 [−0.359; 0.310] p = 0.914; q = 0.992 | −0.015 [−0.367; 0.334] p = 0.928; q = 0.980 |
| gldm_LargeDependenceHighGrayLevelEmphasis | 0.244 [−0.110; 0.544] p = 0.126; q = 0.399 | 0.084 [−0.212; 0.371] p = 0.602; q = 0.880 | 0.093 [−0.273; 0.426] p = 0.568; q = 0.808 |
| gldm_DependenceNonUniformityNormalized | 0.197 [−0.136; 0.484] p = 0.215; q = 0.445 | −0.138 [−0.415; 0.191] p = 0.389; q = 0.820 | −0.163 [−0.421; 0.206] p = 0.313; q = 0.615 |
| glcm_MCC | 0.069 [−0.268; 0.394] p = 0.665; q = 0.702 | −0.197 [−0.482; 0.137] p = 0.216; q = 0.820 | −0.204 [−0.460; 0.108] p = 0.208; q = 0.564 |
| glrlm_RunVariance | −0.099 [−0.404; 0.224] p = 0.538; q = 0.674 | 0.203 [−0.112; 0.462] p = 0.202; q = 0.820 | 0.213 [−0.118; 0.475] p = 0.187; q = 0.564 |
| firstorder_Skewness | −0.085 [−0.388; 0.233] p = 0.600; q = 0.674 | −0.155 [−0.452; 0.164] p = 0.333; q = 0.820 | −0.155 [−0.467; 0.180] p = 0.338; q = 0.615 |
In this cohort, five of the 19 predefined radiomic features correlated with continuous Ki-67 after FDR correction. Interpretation of these associations depends on their overlap with uptake intensity and tumor volume, the influence of lesion size, and the limitations of a small cohort. Prior selection based on technical criteria enabled biological evaluation of a panel defined independently of Ki-67.
Surov et al. [6] included 32 studies comprising 1802 patients in their meta-analysis. The [18F]FDG PET/CT analysis included 25 studies with 1624 patients and estimated an SUVmax–Ki-67 correlation of 0.40 (95% CI, 0.34–0.46). In our study, the coefficients were 0.565 for SUVmax and 0.562 for SUVmean. Our values were numerically higher, but showed the same direction and support a relationship between FDG uptake intensity and proliferation. The difference between the correlations does not establish a statistically stronger association in our cohort, given the substantial differences in populations, imaging protocols, and Ki-67 assessment methods.
In a cohort of 114 patients, Li et al. [19] used a Ki-67 cutoff of ≥20% and reported higher SUVmax, SUVmean, and MTV in the high-proliferation group. In our cohort, using a 30% cutoff, rank-biserial effect sizes were 0.614 for SUVmax, 0.623 for SUVmean, 0.364 for MTV, and 0.450 for TLG. For firstorder_90Percentile, the corresponding effect size was RBC = 0.623 (q = 0.008). These results place this feature within the same range of association with proliferation as the conventional parameters. Different Ki-67 cutoffs limit direct comparison between studies.
Studies by de Mooij et al. [7], Groheux et al. [29], and Heudel et al. [30] documented correlations between tracer uptake and histopathological or immunohistochemical characteristics. In our cohort, 36 of the 42 patients had hormone receptor-positive tumors, and eight were HER2-positive. The predominance of hormone receptor-positive tumors and the distribution of tumor grades require PET–Ki-67 associations to be interpreted in the context of tumor phenotype.
Ha et al. [11] analyzed 109 radiomic features in 73 patients with locally advanced breast cancer. Unsupervised clustering identified three radiomic patterns that differed in Ki-67 expression, using a cutoff of >30% to define high proliferation. In our study, the 19 features were evaluated individually, yielding five associations after FDR correction. The strongest association was observed for firstorder_90Percentile (ρ = 0.556; q = 0.002). Both studies support a relationship between the PET phenotype and proliferation, but differences in populations and methods preclude direct validation of our features by the patterns identified by Ha et al.
In 171 patients with ER-positive tumors, Lemarignier et al. [16] found strong correlations between the four texture features evaluated and MTV, as well as associations with histological type, but no significant associations with the immunohistochemical characteristics examined. This observation reinforces the volume dependence also observed in our cohort. In addition, findings from dedicated breast PET studies, such as that of Moscoso et al. [17], should be interpreted separately from the whole-body acquisitions used in our study.
In a cohort of 153 patients, Araz et al. [31] did not identify radiomic features significantly associated with hormone receptor status, whereas the conventional parameters SUV and TLG showed significant associations. Radiomic associations with Ki-67 were observed in our cohort, but the different biological endpoint prevents direct comparison of the results. The studies by Antunovic et al. [32], Liu et al. [33], and Gelardi et al. [34] addressed treatment response or molecular classification. Their findings cannot be extrapolated to the clinical performance of the panel evaluated here.
Across three tumor types, including 54 breast lesions, Orlhac et al. [35] found that three histogram indices were strongly correlated with SUV (|r| ≥ 0.84), while four texture indices were dependent on MTV. In our study, firstorder_90Percentile correlated with SUVmax at ρ = 0.983, whereas firstorder_TotalEnergy correlated with TLG at ρ = 0.988. These findings are consistent with substantial overlap between radiomic information and conventional PET parameters. However, the Pearson coefficients reported by Orlhac et al. and the Spearman coefficients used here are not interchangeable estimates, and the features and preprocessing were not identical.
Adjustment for SUVmax and/or MTV attenuated the five main radiomic associations, and an independent contribution was not demonstrated. The adjusted results should be interpreted as an assessment of information shared within the same image, without establishing a causal relationship. Sphericity was significantly associated with Ki-67 after FDR correction only in the MTV-adjusted analysis. This finding should be considered exploratory.
Feature definitions help explain this overlap [27,28]. firstorder_90Percentile describes the upper levels of uptake, whereas TotalEnergy depends on the sum of squared intensities and voxel volume. Texture features describe other properties: gldm_LargeDependenceHighGrayLevelEmphasis emphasizes large dependencies with high gray levels, glszm_LowGrayLevelZoneEmphasis emphasizes zones with low gray levels, and glcm_Correlation describes relationships between neighboring gray levels. The directions observed in our study are compatible with a different uptake distribution in tumors with greater proliferation, but do not by themselves identify a biological mechanism. Redundancy filtering among radiomic features does not ensure their independence from intensity or volume. With fixed-bin-width discretization, features that weight gray levels remain linked to the SUV scale. 90Percentile and TotalEnergy are calculated from the original, non-discretized intensities and are therefore unaffected by the discretization setting [28].
After analyzing 555 PET/CT examinations across several cancer types, Hatt et al. [36] concluded that the relationship between texture and volume varied with tumor size, with the information becoming relevant above approximately 10 cm³ and increasing with volume. In our cohort, the median segmented volume was 10.629 cm³, with a minimum of 0.793 cm³. After exclusion of the six small lesions (mean native voxel count <100), the SUVmax and 90th percentile correlations were similarly attenuated to 0.440 and 0.427. This attenuation cannot be attributed solely to technical factors, because exclusion reduced both the sample size and the range of volumes. Moreover, all six excluded lesions had Ki-67 <30%, which also changed the distribution of proliferation.
Brooks and Grigsby [37] and Soret et al. [38] described the influence of lesion size and the partial-volume effect on PET quantification and heterogeneity. Araz et al. [31] excluded tumors with fewer than 64 voxels. We retained small lesions in the primary analysis and separately tested exclusion of those with a mean native voxel count <100. Thresholds expressed as voxel counts are not directly comparable across studies, because physical voxel volume and image resolution affect the amount of information available.
Pfaehler et al. [39], Altazi et al. [40], and Galavis et al. [41] showed that some PET radiomic features are sensitive to reconstruction, discretization, noise, or segmentation. Aide et al. [18] also demonstrated the influence of reconstruction on breast tumor characterization. In our study, the use of a single scanner and a common protocol limited technical variation, but the Ki-67 analysis used only one extraction configuration. The previous interobserver assessment [20] does not establish that the association with Ki-67 persists after changes in preprocessing.
In our previous study, we defined the radiomic feature panel on the basis of reproducibility and redundancy [20]. The present analysis evaluates a distinct property: the association of radiomic features with Ki-67. A feature can be measured reproducibly without having a demonstrable association with a biological marker. Oliveira et al. [42] showed, in a different tumor setting (lung cancer), that preselection of robust PET features did not improve clinical outcome modeling. This distinction between technical robustness and biological relevance is also supported by the methodological literature [23,24].
The strength of our design lies in defining the panel before the Ki-67 analysis, without adding or removing features on the basis of the biological endpoint. However, technical selection and the present evaluation were performed in the same cohort, whose inclusion depended on the availability of clinicopathological data. A predefined panel therefore does not constitute independent validation. Reporting all 19 coefficients and their confidence intervals allows the magnitude and uncertainty of the associations, including nonsignificant findings, to be assessed.
Separate analyses for the two observers supported the internal consistency of the main continuous associations: 90Percentile, TotalEnergy, LargeDependenceHighGrayLevelEmphasis, and LowGrayLevelZoneEmphasis remained significant after FDR correction for both segmentations. glcm_Correlation showed the same direction but was significant only for the first observer. These findings indicate differential sensitivity of the features to segmentation and relate to the same patients and images, without validation across centers or scanners.
This study is limited by the small cohort, retrospective single-center design, and lack of independent validation. The inherent requirement for complete clinicopathological data, including histological grade, may introduce selection bias, and analysis of a single dominant lesion does not capture the full heterogeneity of the disease. Collinearity with SUV and MTV, small lesions, and segmentation variability limit biological interpretation. Ki-67 values were obtained from routine pathology reports, without standardization of the antibody clone or scoring within this study, both of which are relevant to marker variability [1,43–45]. The biopsy-to-PET interval and the influence of clinical stage, blood glucose, and individual uptake time were not evaluated. The imbalanced distributions of tumor grades and subtypes, together with use of a single extraction configuration, limit generalizability. The results describe exploratory associations and do not establish the predictive performance or clinical utility of the panel. As in other fields of quantitative imaging, translation of such associations into clinical practice requires external validation and standardized reporting [46,47].
In this single-center cohort of 42 women with untreated primary breast carcinoma, five of the 19 PET/CT radiomic features predefined exclusively on the basis of reproducibility and redundancy were associated with continuous Ki-67 after FDR correction.
The five primary radiomic associations were similar in magnitude to those of conventional PET parameters, but did not remain significant after adjustment for MTV, SUVmax, or both parameters.
Our findings suggest a relationship between stable radiomic features and tumor proliferation, but do not demonstrate an independent contribution beyond conventional PET parameters. Confirmation in independent cohorts should account for lesion volume, segmentation, and standardized Ki-67 assessment.
Conflicts of interest and sources of funding
The authors declare no conflict of interest. This research received no external funding.
Acknowledgments All figures and tables are original.
Authors’ contribution
Conceptualization, A.M.; methodology, A.M. and R.-M.M.; validation, R.-M.M., V.-O.B. and C.C.; formal analysis, A.M., C.M. and I.-N.M.; writing—original draft preparation, A.M.; writing—review and editing, A.M., I.-N.M., R.-M.M., V.-O.B.; visualization, C.M., I.-N.M.; supervision, I.-N.M. All authors have read and approved the submitted version of the manuscript.
Ethics approval and consent to participate
The study was conducted in accordance with the Declaration of Helsinki and approved by the Local Ethics Committee of the “Dr. Carol Davila” Central Military Emergency University Hospital, Bucharest, Romania, approval number 763/11.03.2025. Informed consent was obtained from all participants involved in the study.
Patient consent for publication
Informed consent was obtained from all participants involved in the study.