
Systemic Lupus Erythematosus (SLE) is a quintessential systemic autoimmune disease, characterized by a wide spectrum of clinical presentations ranging from mild forms to severe, including organ-threatening exacerbations that can lead to significant disability or mortality. The association between SLE and endocrine disorders, particularly thyroid dysfunction and autoimmunity, is well-established, with studies reporting a prevalence of hypothyroidism (of any cause) in SLE patients between 3% and 21% [1-3]. Autoimmune Hashimoto’s thyroiditis was confirmed more often than it was found in the general population, mostly driven by common autoimmune pathways [2-4], but the clear underlying mechanisms are less understood so far.
A connected genetic background was reported: a shared susceptibility conferred by polymorphisms in genes regulating immune tolerance, such as PTPN22 and CTLA-4, and by classic associations with HLA alleles like HLA-DR3 [5-7]. This genetic vulnerability is compounded by the dysregulation of common immune pathways. For instance, T helper 17 (Th17) cell axes and their associated cytokines are known to play a central role, not only in the pathogenesis of SLE, but also in the lymphocytic infiltration of the thyroid gland amid the diagnosis of autoimmune thyroiditis [8-10].
This co-diagnosis involves a larger spectrum of clinical challenges. The nonspecific symptoms of thyroid dysfunction (e.g., fatigue, weight changes, myalgia, and mood disturbances) frequently overlap with the constitutional manifestations of SLE [9-11]. This can lead to an underdiagnosis of the thyroid condition, with its symptoms being erroneously attributed solely to the lupus activity. Even subclinical hypothyroidism, which is more prevalent in patients with systemic autoimmune diseases versus the general population, might perpetuate a state of low-grade inflammation and negatively impact quality of life in addition to causing potential anomalies of the cardiometabolic status, such as those involving the glucose and lipid profile, and even a higher level of persistent oxidative stress [11-13].
An additional challenge is found in the overlapping landscape of biological markers in treatment-naïve individuals, as highlighted in those who are on specific medication against SLE or in those presenting other complications or co-ailments (e.g., cardiovascular and metabolic conditions, osteoporosis/osteoporotic fractures, vitamin D deficiency, etc.). Corticosteroids, a mainstay of SLE therapy, can independently alter glycaemic control and lipid status, while other immunomodulators might modify the inflammatory and protein profile [12-14].
Overall, there is a current gap in addressing thyroid status in SLE patients, starting with early recognition of thyroid anomalies in individuals who are newly diagnosed with the rheumatologic ailment and continuing with long-term strategies of diagnosis and therapy.
We aimed to analyse the thyroid profile (function, ultrasound, and circulating anti-thyroperoxidase antibodies) in relation to the clinical status, as well as immunological biomarkers in newly diagnosed SLE patients versus SLE-free controls.
This observational, cross-sectional, retrospective, real-life, single-centre study was conducted at a single department of a multidisciplinary university hospital, namely, “Dr. Carol Davila” Central Military Emergency University Hospital in Bucharest, Romania.
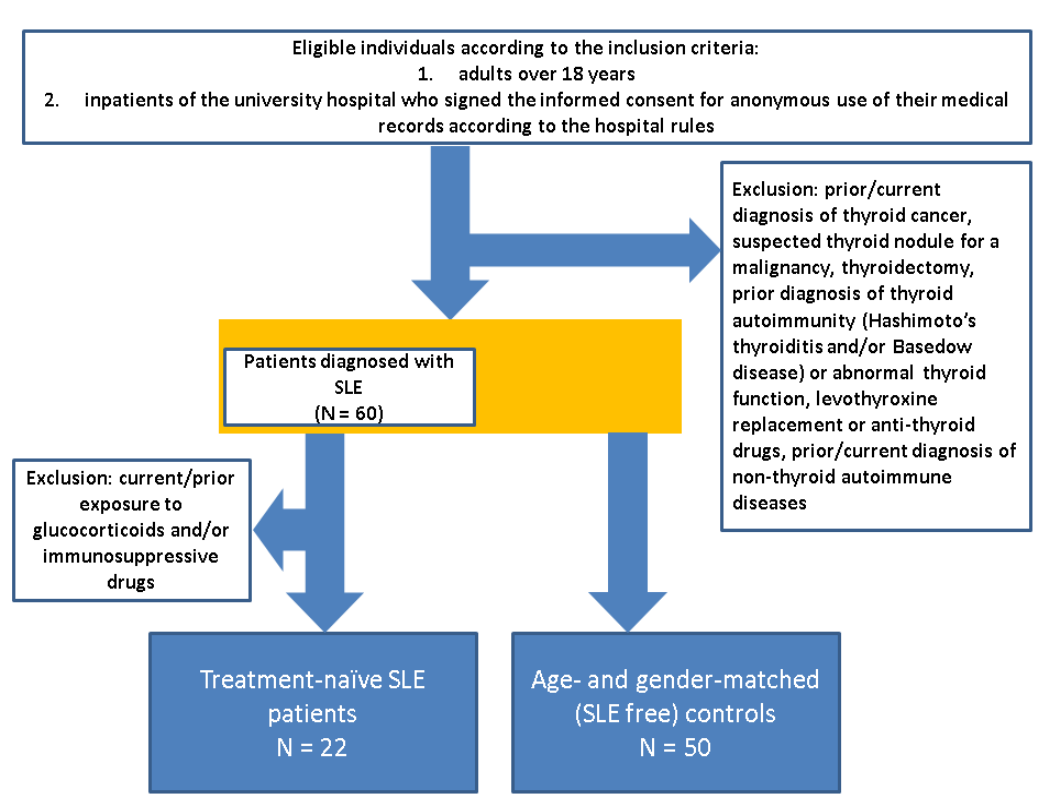
Individuals who were newly diagnosed with SLE were included according to the 2012 Systemic Lupus International Collaborating Clinics (SLICC) classification criteria [15]. Inclusion criteria: adults over 18 years, treatment-naïve SLE subjects, inpatients of the university hospital who signed informed consent for anonymous use of their medical records according to the hospital rules/protocol.
We excluded subjects with a prior/current diagnosis of thyroid cancer, suspected thyroid nodule for a malignancy, thyroidectomy, prior diagnosis of a thyroid autoimmunity (Hashimoto’s thyroiditis and/or Basedow disease), or abnormal thyroid function, levothyroxine replacement or anti-thyroid drugs, prior/current diagnosis of non-thyroid autoimmune diseases, oncologic conditions, infections, current/prior exposure to glucocorticoids and/or immunosuppressive drugs.
The control group included SLE-free individuals who were hospitalized at the same hospital/department and did not meet any criteria of suspicion/conformation for SLE and also met all the previously mentioned exclusion criteria. (Figure 1)
Data collection included demographic parameters (e.g., age, sex, current smoking), clinical presentation, including constitutional symptoms (e.g., fever, chills, asthenia, fatigue, recent weight loss of at least 1 kg within the last month), and systemic manifestations categorized by the organ system.
SLE disease activity was quantified using the SELENA-SLEDAI (Systemic Lupus Erythematosus Disease Activity Index), and functional disability was assessed with the Barthel index.
The lab parameters included: hematologic profile (complete blood count with differential); inflammatory markers [erythrocyte sedimentation rate (ESR), C-reactive protein (CRP), and fibrinogen]; serum protein electrophoresis (albumin, alpha-1, alpha-2, beta, and gamma globulin fractions). Immunologic profile involved testing complement fractions (C3, C4), in addition to the following antibodies: ANA (antinuclear antibody), anti-dsDNA (anti-double-stranded DNA antibody), anti-Ro/SSA, anti-RNP/Sm (anti-ribonucleoprotein and Smith proteins antibodies), aCL (anti-cardiolipin antibody), and aβ2GPI (anti-β2-glycoprotein I antibody), as well as rheumatoid factor.
Thyroid profile included functional assessment based on thyroid-stimulating hormone (TSH), free thyroxine (FT4), and total triiodothyronine (T3), in association with an anti-thyroperoxidase (TPO) antibody assay.
We designated the following categories based on serum TSH (normal range: 0.27 – 4.2 µIU/mL) and FT4 (normal range: 0.89 – 1.76 ng/dL) levels; subclinical hypothyroidism (TSH > 4.2 µIU/mL with FT4 within the normal range); hyperthyroidism [TSH < 0.27 µIU/mL with FT4 above the normal range (> 1.76 ng/dL) and/or high T3 levels]; and low T3 syndrome [T3 below the normal range (< 0.8 ng/mL) with TSH and FT4 within normal limits under circumstances of a systemic illness]. Autoimmune thyroiditis was defined by an ATPO level above the upper normal range (> 34 UI/mL).
Additionally, 25-hydroxyvitamin D (25OHD) was measured (vitamin D deficiency was defined as a serum 25OHD level below 20 ng/mL), and glycated haemoglobin (HbA1c) was measured, with prediabetes defined based on a level between 5.7% and 6.4% and diabetes associated with a value of ≥ 6.5%. Alternatively, an abnormal glycaemic control was defined as any HbA1c value ≥ 5.7%.
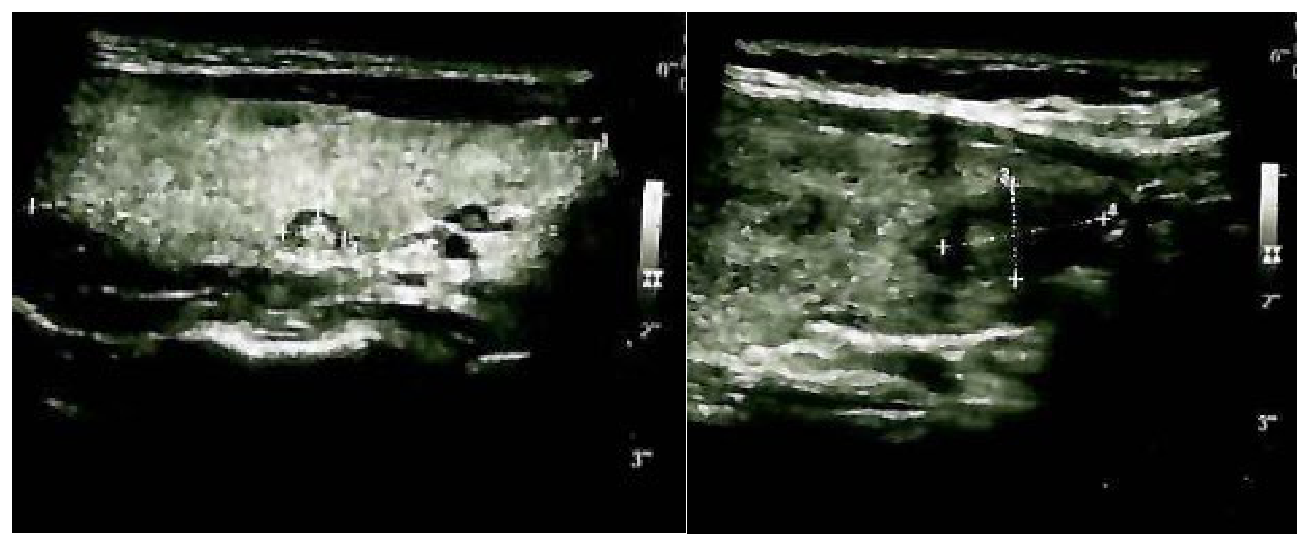
An anterior neck ultrasound was performed, and data on thyroid nodules were collected, which were categorized by the maximum nodule diameter into three size groups: less than 5 mm (category I), between 5 and 10 mm (category II), and larger than 10 mm (category III). (Figure 2)
Statistical analysis was performed using a computational environment with Python statistical libraries (SciPy, Statsmodels). The distribution of continuous variables was assessed for normality. Non-normally distributed data were presented as median and interquartile range [IQR]. Categorical variables were presented as counts (n) and percentages (%). The following statistical tests were employed: The Mann-Whitney U test was used for the comparison of continuous variables between the two independent groups (SLE and control); Fisher’s Exact Test was used for the comparison of categorical variables, which is appropriate for the sample size and distribution of the data. Correlations between continuous variables within the SLE cohort were assessed using Spearman’s rank correlation coefficient (rho). A two-tailed p-value of less than 0.05 was considered statistically significant.
All participants signed the informed consent for their anonymized medical data to be used for research purposes according to the hospital rules for inpatients. The study was conducted in accordance with the Declaration of Helsinki. The protocol was approved by the Ethics Committee of “Dr. Carol Davila” Central Military Emergency University Hospital (approval number 758 from 11 March 2025).
The study included 72 individuals (N = 22 newly diagnosed SLE patients versus 50 SLE-free controls with the same age and gender distribution, specifically, mean age of 49.59 ± 16.24 versus 49.88 ± 15.94 years, female prevalence of 77.27% versus 76%).
SLE patients had a statistically significantly higher prevalence of constitutional symptoms, e.g., fever (27.3% versus 0%, p < 0.001) and weight loss (27.3% versus 4%, p = 0.009). The most common systemic involvements were musculoskeletal, arthralgia (72.7%), and arthritis (40.9%), being more prevalent than found in the control group (p < 0.001 for each). Cutaneous and mucosal manifestations, such as malar rash (36.4%) and erythema (36.4%), were exclusively present in the SLE group (p < 0.001). (Table 1)
| Parameter | SLE Group (N = 22) | Control Group (N = 50) | p-value |
|---|---|---|---|
| Age (years), mean ± SD | 49.59 ± 16.24 | 49.88 ± 15.94 | 0.950 |
| Female, N (%) | 17 (77.27%) | 38 (76.00%) | 0.901 |
| Smokers N (%) | 4 (18.18%) | 8 (16.00%) | 0.900 |
| Constitutional symptoms | |||
| Fever, N (%) | 6 (27.27%) | 0 (0.00%) | <0.001 |
| Chills, N (%) | 1 (4.54%) | 0 (0.00%) | 0.232 |
| Asthenia, N (%) | 8 (36.40%) | 16 (32.00%) | 0.771 |
| Fatigue, N (%) | 5 (22.70%) | 6 (12.00%) | 0.287 |
| Weight loss, N (%) | 6 (27.30%) | 2 (4.00%) | 0.009 |
| Clinical manifestations of the system | |||
| Arthralgia, N (%) | 16 (72.70%) | 15 (30.00%) | <0.001 |
| Arthritis, N (%) | 9 (40.91%) | 0 (0.00%) | <0.001 |
| Myalgia, N (%) | 3 (13.60%) | 1(2.00%) | 0.096 |
| Myopathy, N (%) | 2 (9.10%) | 0 (0.00%) | 0.088 |
| Malar rash, N (%) | 8 (36.36%) | 0 (0.00%) | <0.001 |
| Erythema, N (%) | 8 (36.36%) | 0 (0.00%) | <0.001 |
| Photosensitivity, N (%) | 3 (13.60%) | 0 (0.00%) | 0.046 |
| Oral ulcers, N (%) | 3 (13.60%) | 0 (0.00%) | 0.046 |
| Alopecia, N (%) | 1 (4.54%) | 0 (0.00%) | 0.232 |
| Purpura, N (%) | 1 (4.54%) | 0 (0.00%) | 0.232 |
| Pleurisy, N (%) | 6 (27.30%) | 0 (0.00%) | <0.001 |
| Pulmonary hypertension, N (%) | 2 (9.10%) | 0 (0.00%) | 0.088 |
| Dyspnoea, N (%) | 2 (9.10%) | 4 (8.00%) | 0.900 |
| Pericarditis, N (%) | 3 (13.60%) | 0 (0.00%) | 0.046 |
| Valvular involvement, N (%) | 2 (9.10%) | 2 (4.00%) | 0.380 |
| Coronary vasculitis, N (%) | 1 (4.54%) | 0 (0.00%) | 0.232 |
| Polyneuropathy, N (%) | 4 (18.18%) | 0 (0.00%) | 0.007 |
| Seizures, N (%) | 2 (9.10%) | 0 (0.00%) | 0.088 |
| Lupus nephritis, N (%) | 1 (4.54%) | 0 (0.00%) | 0.232 |
| Ascites, N (%) | 2 (9.10%) | 0 (0.00%) | 0.088 |
| Abdominal pain, N (%) | 2 (9.10%) | 2 (4.00%) | 0.380 |
| Lymphadenopathy, N (%) | 2 (9.10%) | 1 (2.00%) | 0.208 |
| Splenomegaly, N (%) | 2 (9.10%) | 0 (0.00%) | 0.088 |
| Dry eye syndrome | 3 (13.60%) | 0 (0.00%) | 0.046 |
| Gait disturbance | 1 (4.54%) | 1 (2.00%) | 0.536 |
Abbreviations: N = number of patients; SD = standard deviation
The lab findings showed lower haemoglobin, leukocytes, and lymphocytes compared to controls (p = 0.003, p = 0.009, and p = 0.024, respectively). The prevalence of anaemia (31.8% versus 4.0%, p = 0.005), leukopenia (31.8% versus 0%, p < 0.001), and lymphopenia (27.3% versus 2.0%, p = 0.003) was statistically significantly higher in the SLE group.
The median ESR was more than threefold higher (39.5 versus 11.0 mm/h, p < 0.001), and the median CRP was over tenfold higher (14.86 versus 1.31 mg/L, p < 0.001) compared to the control group. Increased fibrinogen level showed a marginal statistical significance in SLE versus SLE-free subjects (p = 0.05). Serum protein electrophoresis revealed a severe dysproteinaemia in the SLE cohort. SLE patients displayed a state of relative hypoalbuminemia, with statistically significantly lower albumin levels compared to controls (p = 0.012) in addition to higher acute-phase reactant fractions, with both alpha-1 and alpha-2 globulins being elevated (p = 0.009 and p < 0.001, respectively). Moreover, a severe hyper-gammaglobulinemia was observed in these patients, with a consequent inverted albumin-to-globulin ratio (1.21 versus 1.58, p < 0.001). (Table 2)
| Parameter | Normal range | Units | SLE group (N = 22) | control group (N = 50) | p-value |
|---|---|---|---|---|---|
| Haemoglobin, Median [IQR] | 11.10-14.70 | g/dL | 11.8 [10.2-13.5] | 13.3 [12.4-14.5] | 0.003 |
| Anaemia, N (%) | 7 (31.82%) | 2 (4.00%) | 0.005 | ||
| Leukocytes, Median [IQR] | 4.1-10.9 | x10³/µL | 5.5 [3.9-7.5] | 7.1 [5.8-8.5] | 0.009 |
| Leukopenia, N (%) | 7 (31.82%) | 0 (0.00%) | <0.001 | ||
| Lymphocytes, Median [IQR] | 1.17-3.17 | x10³/µL | 1.5 [0.9-2.1] | 2.0 [1.6-2.4] | 0.024 |
| Lymphopenia, N (%) | 6 (27.27%) | 1 (2.00%) | 0.003 | ||
| Platelets, Median [IQR] | 140-440 | x10³/µL | 257 [185-330] | 264 [215-310] | 0.735 |
| Thrombocytopenia, N (%) | 4 (18.18%) | 1 (2.00%) | 0.027 | ||
| ESR, Median [IQR] | 0-30 | mm/h | 39.5 [20.0-58.0] | 11.0 [6.0-17.0] | <0.001 |
| CRP, Median [IQR] | 0-5 | mg/L | 14.86 [1.32-30.96] | 1.31 [0.54-4.10] | <0.001 |
| Fibrinogen, Median [IQR] | 276-471 | mg/dL | 489 [377-571] | 395 [337-466] | 0.05 |
| Ferritin, Median [IQR] | 10-120 | µg/L | 97.5 [29.5-356.8] | 81.4 [34.0-180.5] | 0.499 |
| C3 (mg/dL), Median [IQR] | 90-180 | mg/dL | 103.9 [75.5-130.0] | 120.2 [98.0- 140.0] | 0.124 |
| Low C3 (<90 mg/dL), N (%) | 9 (40.91%) | 0 (0.00%) | <0.001 | ||
| C4 (mg/dL), Median [IQR] | 10-40 | mg/dL | 18.7 [8.0-28.0] | 24.1 [18.0-30.0] | 0.056 |
| Low C4 (<10 mg/dL), N (%) | 7 (31.82%) | 0 (0.00%) | <0.001 | ||
| Positive ANA (<1:80), N (%) | 22 (100.00%) | 0 (0.00%) | <0.001 | ||
| Positive rheumatoid factor (>14 UI/mL), N (%) | 6 (27.27%) | 1 (2.00%) | 0.003 | ||
| Positive anti-dsDNA (<25 U/mL), N (%) | 12 (54.55%) | 0 (0.00%) | <0.001 | ||
| Positive anti-Ro/SSA (<15 U/mL), N (%) | 8 (36.36%) | 0 (0.00%) | <0.001 | ||
| Positive anti-RNP/Sm (<15 U/mL), N (%) | 3 (13.64%) | 0 (0.00%) | 0.046 | ||
| Positive aCL (<10 U/mL), N (%) | 3 (13.60%) | 0 (0.00%) | 0.046 | ||
| Positive aβ2GPI (<10 U/mL), N (%) | 4 (18.18%) | 0 (0.00%) | 0.007 | ||
| Albumin, Median [IQR] | 3.5-5.2 | g/dL | 4.00 [3.80-4.30] | 4.41 [4.14-4.63] | 0.012 |
| Alpha-1 Globulins, Median [IQR] | 0.2-0.4 | g/dL | 0.30 [0.20-0.40] | 0.30 [0.20-0.30] | 0.009 |
| Alpha-2 Globulins, Median [IQR] | 0.5-0.9 | g/dL | 0.80 [0.60-0.90] | 0.70 [0.60-0.75] | <0.001 |
| Beta1 Globulins, Median [IQR] | 0.3-0.5 | g/dL | 0.42 [0.40-0.50] | 0.40 [0.40-0.50] | 0.412 |
| Beta2 Globulins, Median [IQR] | 0.2-0.5 | g/dl | 0.40 [0.30-0.50] | 0.40 [0.30-0.45] | 0.654 |
| Total Beta Globulins, Median [IQR] | 0.7-1.2 | g/dL | 0.90 [0.70 – 0.90] | 0.80 [0.75-0.90] | 0.048 |
| Gamma Globulins, Median [IQR] | 0.8-1.4 | g/dL | 1.60 [1.40-1.80] | 1.10 [1.00-1.25] | <0.001 |
| Total Globulins, Median [IQR] | 2.0-3.7 | g/dL | 3.52 [3.10-3.90] | 2.90 [2.70-3.15] | <0.001 |
| Albumin/globulin ratio | 1.0-2.6 | 1.14 [1.02-1.34] | 1.52 [1.40-1.70] | <0.001 |
Abbreviations: ANA = antinuclear antibody; Anti-dsDNA = anti-double-stranded DNA antibodies; Anti-RNP/Sm = anti-ribonucleoprotein and Smith proteins antibodies; aCL = anti-cardiolipin antibody; aβ2GPI = anti-β2-glycoprotein I antibody; CRP = C reactive protein; C3, C4 = complement fractions; ESR = erythrocyte sedimentation rate; IQR = interquartile range; N = number of patients
The levels of thyroid hormones (TSH, FT4, and T3) and TPO antibodies were similar between the SLE group and the SLE-free group. The prevalence of thyroid dysfunction was higher in SLE individuals versus controls (27.27% versus 2%, p = 0.001), with most patients presenting subclinical hypothyroidism across the mentioned thyroid function anomalies.
A higher prevalence of autoimmune thyroiditis (as defined by positive circulating TPO according to the study protocol) in the SLE group (27.3%) compared to the control group (14%) did not reach statistical significance (p = 0.236). Thyroid ultrasound findings in terms of the highest size-based nodules categories rates displayed no between-group differences.
Additional parameters (25OHD and glucose status) showed a similar profile. (Table 3)
| Parameter | Normal range | Units | SLE group (N = 22) | Control Group (N = 50) | p-value |
|---|---|---|---|---|---|
| TSH | 0.35-4.94 | µUI/mL | 1.77 [1.27-4.06] | 1.69 [1.08-2.46] | 0.901 |
| FT4 | 0.70-1.48 | ng/dL | 0.97 [0.87-1.13] | 0.97 [0.91-1.05] | 0.842 |
| T3 | 0.64-1.52 | ng/mL | 1.11 [0.80 – 1.27] | 1.02 [0.90-1.16] | 0.156 |
| TPO | 0.00-5.61 | µUI/mL | 0.65 [0.35-11.94] | 0.61 [0.30-2.86] | 0.634 |
| Positive TPO, N (%) | ˃5.61 | 6 (27.27%) | 7 (14.00%) | 0.236 | |
| Subclinical hypothyroidism, N (%) | 3 (13.64%) | 1(2.00%) | 0.076 | ||
| Hyperthyroidism, N (%) | 1(4.55%) | 0 (0.00%) | 0.305 | ||
| Low T3 syndrome, N (%) | 2 (9.09%) | 0 (0.00%) | 0.090 | ||
| Thyroid dysfunction, N (%) | 6 (27.27%) | 1 (2.00%) | 0.001 | ||
| Category I of thyroid nodules*, N (%) | 2 (9.09%) | 6 (12.00%) | 0.900 | ||
| Category II of thyroid nodules**, N (%) | 1 (4.55%) | 3 (6.00%) | 0.990 | ||
| Category III of thyroid nodules***, N (%) | 1 (4.55%) | 2 (4.00%) | 0.900 | ||
| 25-hydroxyvitamin D | >20 | ng/mL | 23.10 [15.50-31.40] | 26.00 [16.60-34.10] | 0.531 |
| Vitamin D deficiency (<20 ng/mL), N (%) | 7 (31.82%) | 13 (26.00%) | 0.771 | ||
| HbA1c | <5.7 | % | 5.35 [5.03-5.70] | 5.40 [5.20-5.70] | 0.829 |
| Abnormal glycaemic control, N (%) | 6 (27.27%) | 12 (24.00%) | 0.900 | ||
| Prediabetes, N (%) | 5 (22.73%) | 10 (20.00%) | 0.990 | ||
| Diabetes Mellitus, N (%) | 1 (4.55) | 2 (4.00%) | 0.900 |
Abbreviations: HbA1c = glycated haemoglobin A1c; TSH = thyroid stimulating hormone; T3 = triiodothyronine; FT4 = free thyroxine; TPO = anti-thyroperoxidase antibodies; */*/*** patients with thyroid ultrasound showing the largest diameter of the thyroid nodule/nodules of less than 5 mm, (category I)*, between 5 and 10 mm (category II)**, and larger than 10 mm (category III)***
SLE individuals presented a moderate level of disease activity, with a median/IQR SELENA-SLEDAI score of 10.5 [8.0-12.0] (ranging between 4 and 53). Functional status, as evaluated by the Barthel index, showed that most patients maintained a high level of independence, with a median score of 100. The SELENA-SLEDAI score was statistically significantly and positively correlated with gamma-globulin levels (rho = 0.55, p = 0.008) and HbA1c (rho = 0.50, p = 0.017), but not with TPO, TSH, or 25OHD. Barthel index was negatively correlated with SELENA-SLEDAI score (rho = -0.56, p = 0.007) and HbA1c (rho = -0.54, p = 0.010), but not with the thyroid profile. (Table 4)
| Parameter | Correlation with SELENA-SLEDAI | Correlation with the BARTHEL index | Title 1 | Title 2 |
|---|---|---|---|---|
| Spearman’s rho | p-value | Spearman’s rho | p-value | |
| SELENA-SLEDAI Score | -0.56 | 0.007 | ||
| Gamma-globulins | 0.55 | 0.008 | -0.21 | 0.344 |
| HbA1c (%) | 0.50 | 0.017 | -0.54 | 0.010 |
| TSH (µIU/mL) | 0.29 | 0.187 | -0.16 | 0.478 |
| TPO (UI/mL) | -0.11 | 0.627 | -0.01 | 0.963 |
| 25-hydroxyvitamin D (ng/mL) | 0.16 | 0.468 | -0.06 | 0.796 |
Abbreviations: HbA1c = glycated haemoglobin A1c; TSH = thyroid stimulating hormone; TPO = anti-thyroperoxidase antibodies
In this study, we found that disease activity, quantified by the SELENA-SLEDAI score, is positively and statistically significantly associated not only with classical markers of immune activation, such as hyper-gammaglobulinemia, but also with markers of metabolic anomalies, such as HbA1c levels, but not with thyroid function or TPO values. This should be interpreted in the context of a small-sample-size cohort with early SLE diagnosis and does not imply long-term thyroid consequences at this point. Current research comparing different autoimmune diseases has shown that essential B-cell activation with resulting hypergammaglobulinemia is also a characteristic feature of other conditions, such as Sjögren’s syndrome, etc., highlighting shared pathophysiological pathways, which involve epigenetic elements, environmental factors, immune and autoimmune contributors, genetic susceptibility, co-occurrence of infections, and potential side effects of the various pharmacologic interventions [3,10].
The SLE group presented a higher rate of thyroid function anomalies, mostly subclinical hypothyroidism, versus the SLE-free group (22.7% versus 2%, p = 0.001). These findings are prone to actively checking the thyroid status in newly diagnosed SLE patients, as concluded by other reported data [1,16-20]. The prevalence of an abnormally elevated TPO in SLE-positive versus SLE-negative individuals was not statistically significant, which may be explained by the statistical power (N = 22) and by the suboptimal diagnosis of Hashimoto’s thyroiditis in this study due to the fact that anti-thyroglobulin antibody testing was not available [21,22]. For instance, in a paediatric, cross-sectional study (N = 50, female-to-male ratio of 7), the rate of positive TPO was 2%, while we found a prevalence of 27.27%. In contrast to this study of Shamma et al. [6], which found a positive correlation between the disease duration and FT4 [6], we only included subjects with a novel SLE diagnosis in order to avoid the iatrogenic bias.
Similarly, Adapa et al. [7] found that 45% of the SLE individuals have a thyroid dysfunction of any type, with subclinical hypothyroidism being the most important contributor (22.5%, particularly in females). Of note, the rate of positive TPO was 21.25% [7]. Konte et al. [8] found in 73 childhood-onset SLE patients that 19% of them had subclinical hypothyroidism [8]. As shown in the present study, Na-Nan et al. [9] found a similar positive TPO prevalence in SLE subjects versus age- and sex-matched controls, and no correlation between SLE disease activity and thyroid function, respectively, the level of circulating antibodies against thyroid [9].
Another aspect involves the fact that thyroid function anomalies might be related not only to positive TPOs but also to incidental non-autoimmune hypothyroidism or thyroiditis with normal circulating antibodies against thyroid (e.g., atrophic thyroiditis). Currently, although the connection between SLE and thyroid disease has been reported, the multi-layered pathogenic interplay might explain the heterogeneous results observed in real-life settings [23].
Notably, we found no between-group differences with respect to the thyroid nodules, according to a size-related classification. Globally, the diagnosis of thyroid nodules represents the most common endocrine anomaly in the general population, with a higher rate in iodine-deficient areas. In this instance, no direct association with thyroid autoimmunity was established unless a hypoechoic, inhomogeneous pattern on ultrasound was co-presented [24,25].
Only a limited number of studies found a relationship between SLE and thyroid nodules, a correlation that is not unanimously recognized. For instance, Amer et al. [1] studied 80 newly diagnosed SLE patients (Egyptian population) in a single-centre cross-sectional analysis published in 2025 and found a positive correlation between SELDAI score and thyroid nodules, as well as the rate of malignancy among these nodules. The prevalence of thyroid nodules in SLE subjects with thyroid function anomalies was 43% [1], while in our group, the thyroid nodules rate was 27.27%, irrespective of thyroid function.
We found no correlation between the presence of thyroid autoimmunity and lupus disease activity, an observation that has been reported before, since the autoimmune involvement might not be synchronous at one point in life [9]. However, symptoms such as asthenia/fatigue, myalgia, cognitive difficulties, or hair loss may be exclusively attributed to lupus, while an underlying thyroid dysfunction may be missed. Even though we did not find a direct correlation between TSH/FT4 and SLE activity, a correction of thyroid dysfunction, regardless of the cause (levothyroxine replacement), is essential for the symptomatic management and for improving the patient’s quality of life and, hence, allowing a clearer assessment of the symptoms that are exclusively related to the lupus disease [16,26-28].
In this study, a similar prevalence of vitamin D deficiency in SLE patients and controls was observed, noting that there is a widespread prevalence of hypovitaminosis D in the general population, influenced by the geographic and lifestyle factors [29]. 25OHD did not correlate with disease activity, while some authors suggested that it might be found in more severe forms of lupus or in the general population with an increased susceptibility to lupus [30-33].
While the overall prevalence of abnormal HbA1c was not significantly different between treatment-free SLE patients and controls, HbA1c was associated with the SELENA-SLEDAI score (rho = 0.5, p = 0.017). This is suggestive of the concept of meta-inflammation, whereas the systemic inflammatory state of lupus itself drives an important metabolic dysregulation [34]. Moreover, HbA1c correlated with functional disability, which suggests that metabolic risk assessment should not be delayed until initiation of corticosteroid treatment, but should be part of the initial evaluation of each SLE patient. Whether glucose profile anomalies are directly or indirectly connected to the thyroid status and overall lupus outcome is still an open matter.
As limitations, we mention the cross-sectional, retrospective study design and the sample size. In this study, we excluded an essential part of the autoimmune thyroid diseases, other than Hashimoto’s thyroiditis, namely, Graves’ disease. Most prior data suggested a more important SLE connection with Hashimoto’s thyroiditis rather than Graves’s disease among the autoimmune thyroid spectrum [35], but this aspect should be added as well, in a larger analysis, and in addition to the metabolic and cardiovascular co-diagnosis (and even some malignancies) across a multidisciplinary perspective [36-43]. A longitudinal cohort might show the evolution of the thyroid anomalies in relation to the SLE outcome (including under various interventional strategies), the incidental thyroid function changes, and newly positive autoimmunity during lifelong surveillance. Other parameters may prove extremely useful, such as testing for anti-thyroglobulin antibodies and anti-TSH receptor antibodies, as well as collecting data regarding the family medical history of autoimmune conditions (e.g., autoimmune polyendocrine syndromes).
Connecting the dots with respect to the thyroid profile in therapy-naïve SLE patients, we found similar TSH, FT4, and TPO levels (versus SLE-free controls), with a higher rate of thyroid dysfunction, mostly subclinical hypothyroidism. Disease activity correlated with HbA1c, not with the thyroid spectrum, as similarly found for the Barthel index. Commonalities in the fields of thyroid and SLE should be taken into account from the onset of the rheumatologic disease. Indirect interplay might involve the glucose profile, as shown by the HbA1c levels. Follow-up of thyroid function and autoimmunity under SLE therapy and a comparison between individuals with TPO-positive versus TPO-negative profiles at baseline might help the understanding of this complex crossroads. A multidisciplinary approach, bringing together rheumatologists and endocrinologists, is mandatory for a tailored strategy and an optimum outcome.
The authors declare no conflict of interest.
This is part of the PhD research at “Carol Davila” University of Medicine and Pharmacy, Bucharest, Romania (contract number 27884 from 30 September 2024).
No generative AI was used during the realization of this article.
Conceptualization, O.P.I., M.C., D.-M.P., and M.L.C..; methodology, O.P.I., M.C., D.-M.P., and M.L.C.; software, O.P.I.; validation, O.P.I., M.C., and M.L.C.; formal analysis, O.P.I., M.C., and M.L.C.; investigation, O.P.I., and M.L.C.; resources, O.P.I., M.C., and M.L.C.; data curation, O.P.I., M.C., D.-M.P., and M.L.C.; writing—original draft preparation, O.P.I..; writing—review and editing, M.C.; visualization, M.C; supervision, O.P.I., M.C., D.-M.P., and M.L.C.; project administration, O.P.I., M.C., and M.L.C.; funding acquisition, M.L.C. All authors have read and agreed to the published version of the manuscript.
The study was conducted in accordance with the Declaration of Helsinki. The protocol was approved by the Ethics Committee of “Dr. Carol Davila” Central Military Emergency University Hospital (approval number 758 from 11 March 2025).
Patient consent was waived due to the retrospective design.