
Osteoporosis and associated fragility (osteoporotic) fractures represent a major health, economic, and social burden in the modern era, which is projected to affect a higher number of people across the aging process, in association with a worldwide increasing population with a larger life span [1,2]. The main cost-drivers are the medications against osteoporosis for primary and secondary fracture prevention assimilated into the wider frame of fracture-associated costs, noting that more than half of the individuals who are candidates for specific medication (bisphosphonates, denosumab, teriparatide, romosozumab) actually remain untreated [3,4]. For instance, the average annual costs of treating osteoporotic fractures vary between 5000 and 6500 billion USD in European countries, Canada, and the USA [5]. In addition, indirect costs involve the osteoporosis-related disability, and related programs of physical rehabilitation, impaired quality of life, reduced productivity, as well as work engagement issues [5,6].
Essentially, the most important epidemiologic impact comes from primary (menopause- and age-related) osteoporosis, but other fracture risks might contribute to enhancing the loss of bone strength, such as chronic diseases, smoking, various neoplasia, and long-term drug use, etc. [7,8]. Recently, type 2 diabetes was found to increase the fracture risk, particularly in menopausal women, by affecting the bone microarchitecture rather than the bone mineral density (BMD), as reflected by the Dual-Energy X-Ray Absorptiometry (DXA) scan [9,10].
In this complex spectrum of osteoporotic fracture risks, it is mandatory to mention the risk of falls that offers the circumstances of a fracture in prior undiagnosed osteoporotic patients [11-13]. The risk of fall is more difficult to be quantified in daily multidisciplinary practice than most of the fractures contributors, and it involves numerous comorbidities, such as blood pressure or glycaemia variations during day time, sarcopenia, fraility, and any type of muscle mass and/or function disturbance, impaired vision, obesity and various gait anomalies, changes of the blood electrolytes levels, etc. [14-16].
In this study, we aimed to analyse the bone profile in menopausal women who suffered a recent low-trauma fall that was further complicated by an osteoporotic fracture.
This was a retrospective, real-life study in menopausal women, between January 2024 and August 2025.
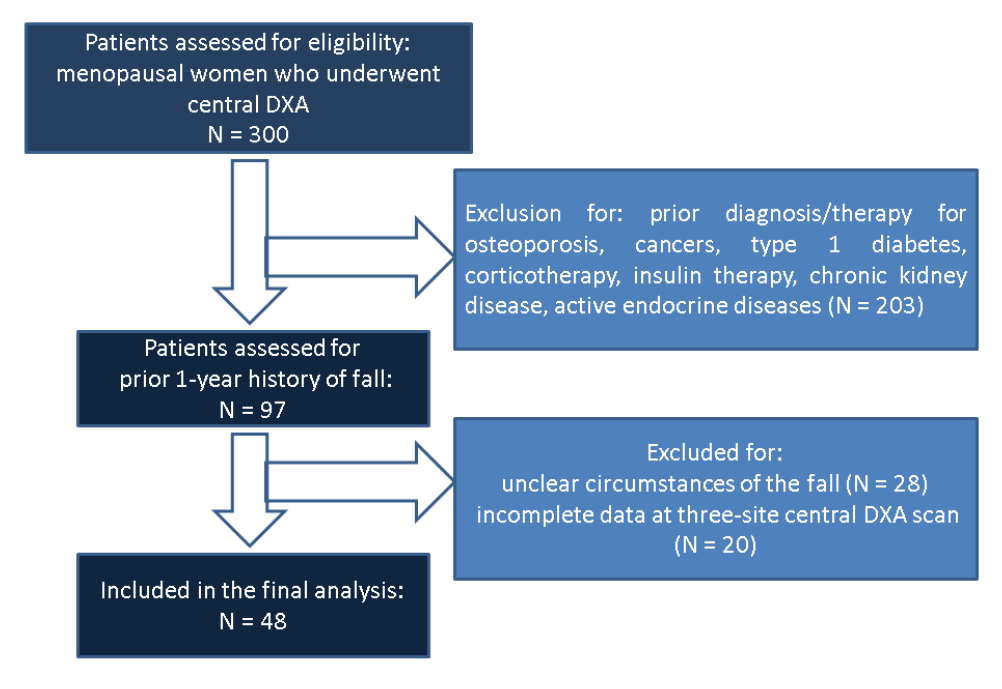
We included patients who suffered a low-trauma fall within the last year before having a DXA assessment. Inclusion criteria were: women of 50 years of older; confirmed menopausal status; patients’ written consent to anonymously use the medical records according to the hospital rules for inpatients; available central DXA scan at three major sites (L1-L4 lumbar spine, femoral neck, and total hip); the subjects were registered with a non-traumatic fall during most recent 12 months (before DXA assessment).
Exclusion criteria were: traumatic falls; prior medication against osteoporosis at any point in life (alendronate, risendronate, zoledronate, denosumab, teriparatide, romosozumab), corticotherapy, insulin therapy, hormone replacement therapy (oestrogens); previous diagnosis of any malignancy, including primary or secondary bone cancers, as well as inherited/acquired bone metabolic disorders, type 1 or secondary diabetes mellitus, chronic kidney failure, active endocrine diseases (e.g. primary or tertiary hyperparathyroidism, hyperthyroidism, prolactinoma, acromegaly, Cushing’s syndrome). Notably, the patients who were previously (before the fall) diagnosed with osteoporosis or osteoporotic fractures were ruled out, even though they did not follow any specific medication against osteoporosis or fracture prevention. Moreover, the subjects with multiple osteoporotic fractures were excluded. The individuals with unclear circumstances of the fall (e.g., domestic accident, street fall, etc.) were also eliminated.
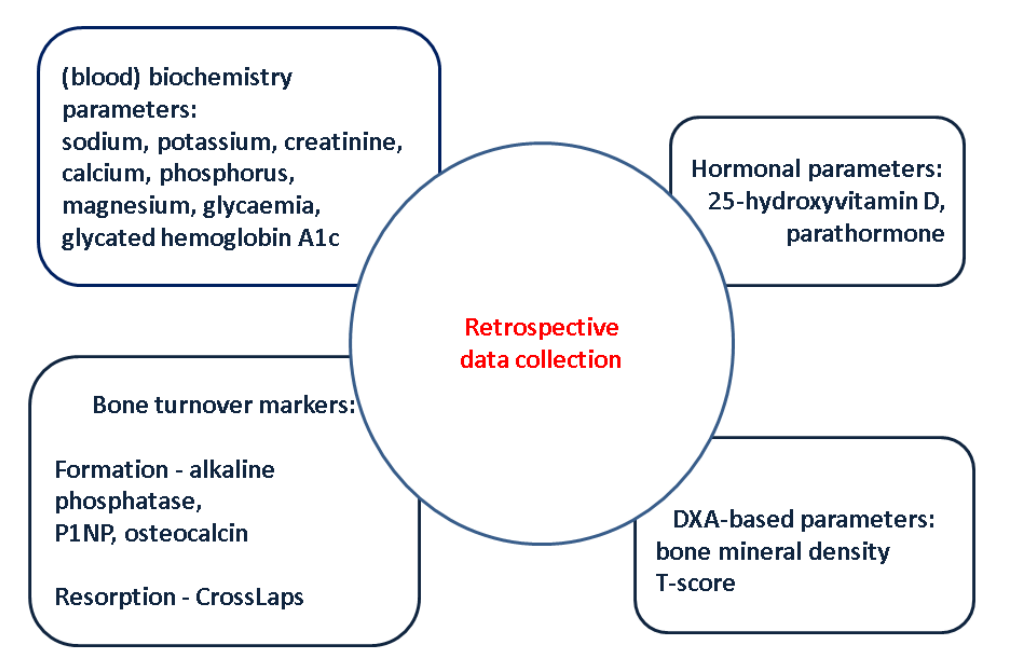
Retrospective data collection included age, menopause duration (since last menstruation), the panel of mentioned comorbidities, biochemical and hormonal parameters, and body mass index (kg/sqm). Also, central DXA (GE Lunar prodigy machine)-based parameters, which provided bone mineral density and T-scores. Osteoporosis was diagnosed according to World Health Organization (WHO) standard criteria and current guidelines: lowest T-score at central DXA of -2.5 or less, respectively, osteopenia in women with the lowest T-score at DXA between -2.5 and -1 [17-19]. Non-interpretable DXA scan was considered if the subjects did not have the available BMD and T-score for lumbar spine, total hip (on the left side), and femoral neck (on the left side), or the scan was not feasible (e.g., severe coxarthrosis, prosthesis, neurosurgery for the spine with local implants, large kidney or gall bladder stones). In this particular instance, the patients were ruled out. (Figure 1)
All patients underwent X-Ray profile of the thoracic and lumbar spine. Prevalent fractures were analysed based on the medical records by two trained radiologists (dr. Costachescu and dr. Preda). The circumstances of the fall and the integration of the fracture as being osteoporotic (low-trauma or spontaneous) fragility fractures were categorized by the medical team according to the data provided during anamnesis at the moment of hospitalization, in addition to the patients’ records. The analyzed fracture sites were: vertebral, hip, leg, forearm, arm, clavicle, etc. (Figure 2)
Individuals with a prevalent fragility fracture were included in group F, and those without a post-fall fracture represented group nonF.
SPSS v.29.0.2.0 (IBM Corp., Armonk, NY, USA) and Excel v16.100.1 (Microsoft, Redmond, WA, USA) were used for the statistical analysis. Continuous variables were assessed with regard to their distribution for normality via the Kolmogorov-Smirnov test, and they were expressed as mean ± standard deviation (SD) in cases with a normal distribution, respectively, as median and quartiles (Q1, Q3) for the parameters with a non-normal distribution. The categorical variables (expressed as absolute numbers and percentages) were explored with respect to the between-group differences by applying the Chi-square test or Fisher’s exact test. The independent sample t-test was used for the comparison of continuous variables between two independent groups, respectively, the Mann–Whitney U test, for the groups with other relationships. The receiver operating characteristic curve was used for different parameters in order to distinguish between the two analysed variables. A cut-off value of less than 0.05 was considered a statistically significant result.
Each patient had at least one hospitalization at “C.I. Parhon” National Institute of Endocrinology, Bucharest, Romania (whereas central DXA was performed). The Ethical Committee of this tertiary centre of endocrinology (“C.I. Parhon” National Institute of Endocrinology, Bucharest, Romania) approved the study (number 33 from 22 September 2025). The study was performed in accordance with the Declaration of Helsinki. Specific consent for participation in this study was waived due to the retrospective design.
A total of 48 patients were included in the final analysis, having a mean age of 63.04 ± 7.95 years, respectively, and a menopause duration of 16.56 ± 10.38 years since menopause. 27.50% of the subjects had prevalent fragility fractures (group F, N = 18) and 62.50% were fracture-free (group nonF, N = 30). Body mass index was similar between the groups, as well as the cardio-metabolic panel, according to the study protocol. (Table 1)
| Parameter | Descriptive statistics (Units) | Entire sample (N = 48, 100%) | Group F (N = 18, 37.50%) | Group nonF (N = 30, 62.50%) | p-value |
|---|---|---|---|---|---|
| Age | Mean ± SD (years) | 63.04 ± 7.95 | 66.72 ± 9.44 | 60.83 ± 6.07 | 0.026 |
| Years since menopause | Mean ± SD | 16.56 ± 10.38 | 21.33 ± 11.97 | 13.70 ± 8.26 | 0.024 |
| Smoker status | N (%) | 8 (16.67) | 1 (5.56) | 7 (23.33) | 0.229 |
| Dyslipidemia | N (%) | 24 (50.00) | 11 (61.11) | 13 (43.33) | 0.371 |
| Type 2 diabetes mellitus | N (%) | 2 (4.17) | 2 (11.11) | 0 (0.00) | 0.136 |
| High blood pressure | N (%) | 30 (62.50) | 11 (61.11) | 19 (63.33) | 0.878 |
| Body mass index | Mean ± SD (kg/sqm) | 25.52 ± 4.45 | 25.25 ± 4.93 | 25.68 ± 4.21 | 0.749 |
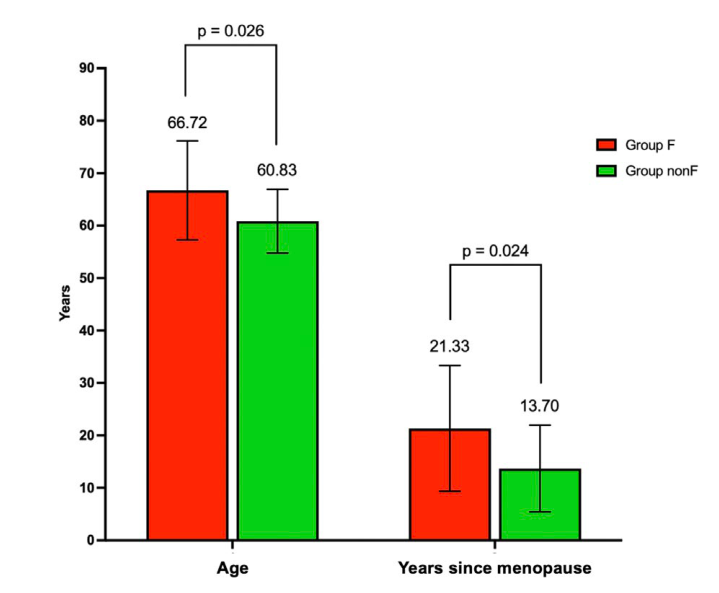
Age was statistically significantly higher in group F of 66.72 ± 9.44 years compared to group nonF of 60.83 ± 6.07 (p = 0.026), as well as years since menopause (21.33 ± 11.97 versus 13.70 ± 8.26, p = 0.024). (Figure 3)
Analysed biochemical parameters were similar between the studied groups. (Table 2)
| Parameter | Descriptive statistics (Units) | Entire sample (N = 48, 100%) | Group F (N = 18, 37.50%) | Group nonF (N = 30, 62.50%) | p-value | Normal range |
|---|---|---|---|---|---|---|
| Fasting glycaemia | Mean ± SD (mg/dL) | 104.57 ± 24.55 | 105.48 ± 30.01 | 102.42 ± 20.16 | 0.756 | 74-106 |
| Glycated hemoglobin | Mean ± SD (%) | 5.48 ± 0.33 | 5.40 ± 0.34 | 5.54 ± 0.33 | 0.298 | 4.8-5.9 |
| Serum creatinine | Mean ± SD (mg/dL) | 0.78 ± 0.10 | 0.76 ± 0.08 | 0.79 ± 0.10 | 0.411 | 0.7-1.2 |
| Serum sodium | Mean ± SD (mmol/L) | 140.41 ± 2.10 | 140.75 ± 1.58 | 140.26 ± 2.31 | 0.592 | 136-145 |
| Serum potassium | Mean ± SD (mmol/L) | 4.46 ± 0.42 | 4.33 ± 0.39 | 4.52 ± 0.42 | 0.219 | 3.5-5.1 |
Total serum calcium had a similar value in group F versus group nonF (9.58 ± 0.37 mg/dL versus 9.57 ± 0.40 mg/dL (p = 0.910). Mean 25-hydroxyvitamin D was 22.82 ± 7.26 ng/mL in group F and 22.92 ± 10.66 ng/mL (p = 0.971) in group nonF. No between-group difference was found with respect to bone formation and resorption markers. (Table 3)
| Parameter | Descriptive statistics (Units) | Entire sample (N = 48, 100%) | Group F (N = 18, 37.50%) | Group nonF (N = 30, 62.50%) | p-value | Normal range |
|---|---|---|---|---|---|---|
| Total serum calcium | Mean ± SD (mg/dL) | 9.57 ± 0.38 | 9.58 ± 0.37 | 9.57 ± 0.40 | 0.910 | 8.4-10.2 |
| Ionized serum calcium | Mean ± SD (mg/dL) | 4.17 ± 0.19 | 4.18 ± 0.20 | 4.16 ± 0.18 | 0.810 | 3.9-4.9 |
| Serum phosphorus | Mean ± SD (mg/dL) | 3.75 ± 0.53 | 3.73 ± 0.48 | 3.76 ± 0.57 | 0.872 | 2.5-4.5 |
| Serum magnesium | Mean ± SD (mg/dL) | 1.95 ± 0.16 | 1.99 ± 0.17 | 1.94 ± 0.16 | 0.440 | 1.6-2.6 |
| 25-hydroxyvitamin D | Mean ± SD (ng/mL) | 22.88 ± 9.35 | 22.82 ± 7.26 | 22.92 ± 10.66 | 0.971 | 30-100 |
| Parathormone | Mean ± SD (pg/mL) | 49.10 ± 21.20 | 40.60 ± 17.07 | 54.76 ± 22.15 | 0.051 | 15-65 |
| Osteocalcin | Median (Q1, Q3) (ng/mL) | 28.67 (17.88, 36.25) | 27.60 (15.98, 37.27) | 29.23 (18.54, 33.86) | 0.457 | 14-46 |
| Alkaline phosphatase | Mean ± SD (U/L) | 82.28 ± 28.09 | 84.73 ± 32.37 | 80.80 ± 25.79 | 0.674 | 35-129 |
| P1NP | Median (Q1, Q3) (ng/mL) | 60.58 (38.89, 84.75) | 69.35 (32.84, 72.00) | 59.33 (42.35, 84.75) | 0.902 | 20.25-76.31 |
| CrossLaps | Median (Q1, Q3) (ng/mL) | 0.50 (0.36, 0.71) | 0.53 (0.37, 0.79) | 0.50 (0.35, 0.59) | 0.476 | 0.330-0.782 |
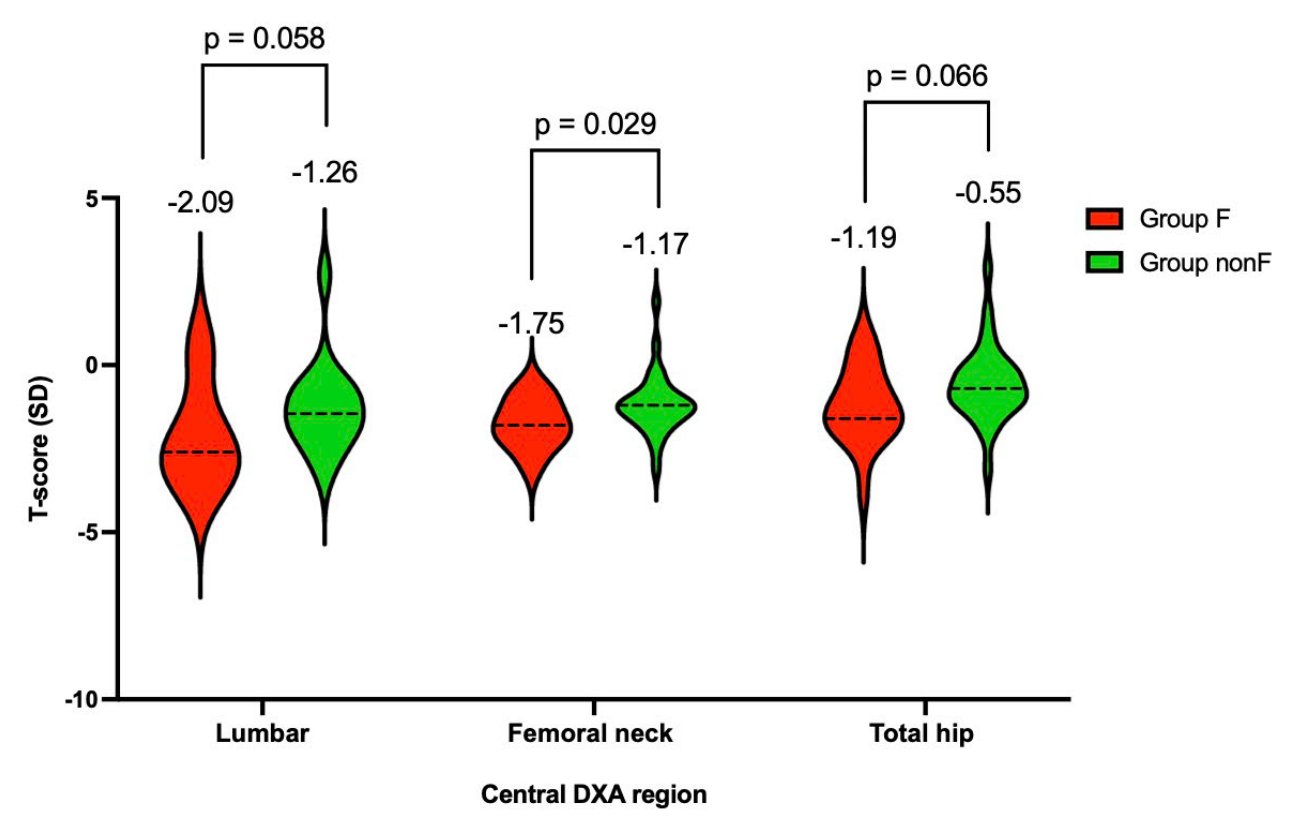
Femoral neck T-score was statistically significantly lower in group F in comparison to group nonF (-1.75 ± 0.72 versus -1.17 ± 0.91, p = 0.029). (Table 4)
| Parameter | Descriptive statistics (Units) | Group F (N = 18, 37.50%) | Group nonF (N = 30, 62.50%) | p-value |
|---|---|---|---|---|
| Lumbar BMD | Mean ± SD (g/sqcm) | 0.927 ± 0.184 | 1.026 ± 0.164 | 0.059 |
| Lumbar T-score | Mean ± SD (SD) | -2.09 ± 1.51 | -1.26 ± 1.37 | 0.058 |
| Femoral neck T-score | Mean ± SD (SD) | -1.75 ± 0.72 | -1.17 ± 0.91 | 0.029 |
| Total hip T-score | Mean (SD) | -1.19 | -0.55 | 0.066 |
Lumbar BMD and T-score were borderline statistically significantly lower in group F compared to group nonF (0.927 ± 0.184 g/sqcm versus 1.026 ± 0.164 g/sqcm, p = 0.059, respectively -2.09 ± 1.51 SD versus -1.26 ± 1.37 SD, p = 0.058). (Figure 4)
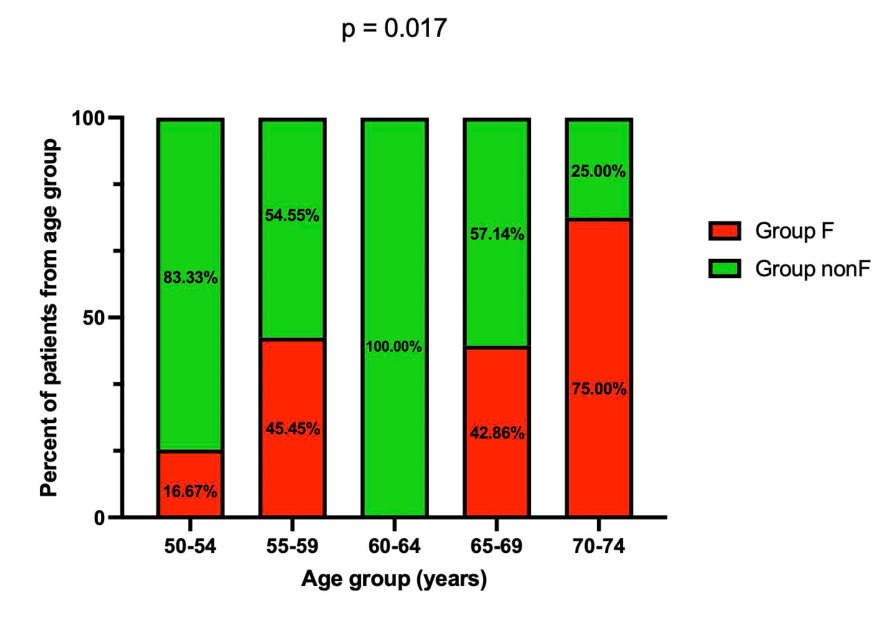
The distribution of patients from group F and group nonF was statistically significantly different among the 5-year age groups (p = 0.017). (Table 5)
| Age group (years) | N (%) | Group F, N (%) | Group nonF, N (%) | p-value |
|---|---|---|---|---|
| 50-54 | 6 (12.50) | 1 (16.67) | 5 (83.33) | 0.017 |
| 55-59 | 11 (22.91) | 5 (45.45) | 6 (54.55) | |
| 60-64 | 9 (18.75) | 0 (0.00) | 9 (100.00) | |
| 65-69 | 14 (29.17) | 6 (42.86) | 8 (57.14) | |
| 70-74 | 8 (16.67) | 6 (75.00) | 2 (25.00) |
The highest prevalence was found in the 60-64 years age-group with respect to the individuals from group nonF, while 75% of the subjects from 70-74 years age-group were identified in group F. (Figure 5)
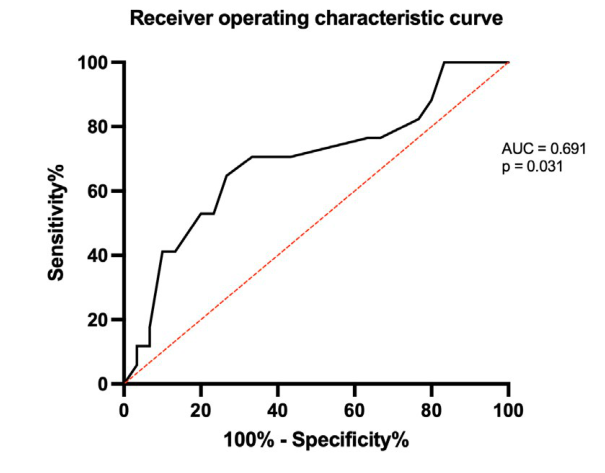
Receiver operating characteristic curve was plotted to determine an optimal femoral neck T-score value to predict the presence of a fragility fracture and it resulted in a value of -1.55 SD with a sensitivity of 64.71 (41.30-82.69) % and a specificity of 73.33 (55.55-85.82) %, with a Youden index of 0.380. (Table 6, Figure 6)
| Cut-off value femoral neck T-score (SD) | AUC | Sensitivity (95% CI) | Specificity (95% CI) | Youden Index |
|---|---|---|---|---|
| -1.55 | 0.691 | 64.71 (41.30-82.69) | 73.33 (55.55-85.82) | 0.380 |
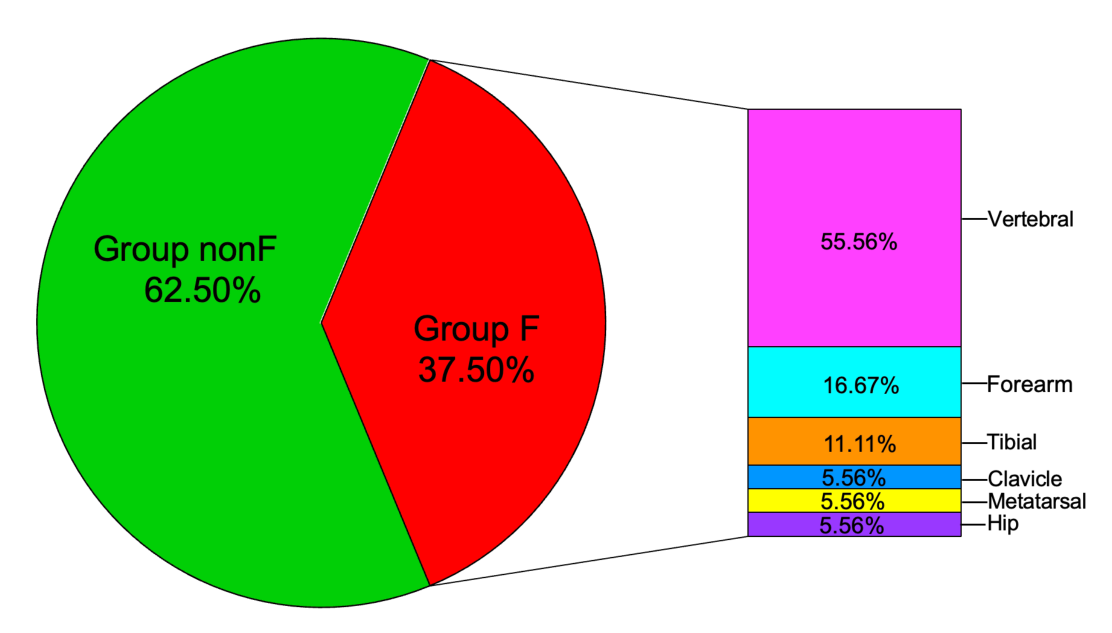
55.56% of patients from group F had vertebral fractures, 16.67% had forearm fractures, 11.11% had tibia fractures, 5.56% had a clavicle fracture, 5.56% had a metatarsal fracture, and 5.56% had a hip fracture. (Table 7)
| Fracture location | N (%) |
|---|---|
| Vertebral | 10 (55.56) |
| Forearm | 3 (16.67) |
| Tibia | 2 (11.11) |
| Clavicle | 1 (5.56) |
| Metatarsal | 1 (5.56) |
| Hip | 1 (5.56) |
The analysis of WHO categories at central DXA showed that in group F, 55.56% (N = 10) of the patients had osteoporosis, and were equally distributed for each category, namely, osteopenia and normal DXA (22.22% per category, N = 4). In group nonF, the highest prevalence was for osteopenia (66.67%, N = 20), and was equally distributed in the other two categories (16.67%, N = 5). (Figure 7)
When analyzing the patients with vertebral versus non-vertebral fractures, the study variables, regardless demographic panel, comorbidities, blood assays and DXA-based parameters, were similar, except for a lower BMD and T-score at lumbar spine in subjects with vertebral versus non-vertebral fractures (0.849 ± 0.151 versus 1.023 ± 0.185 g/sqcm, p = 0.042, respectively, -2.72 ± 1.22 versus -1.30 ± 1.54, p = 0.044). (Table 8)
| Parameter | Descriptive statistics (Units) | Group with vertebral fractures (N = 10, 55.56%) | Group with non-vertebral fractures (N = 8, 44.44%) | p-value |
|---|---|---|---|---|
| Age | Mean ± SD (years) | 69.90 ± 10.65 | 62.75 ± 6.16 | 0.112 |
| Years since menopause | Mean ± SD | 25.60 ± 13.13 | 16.00 ± 8.25 | 0.091 |
| Smoker status | N (%) | 0 (0.00) | 1 (12.50) | 0.444 |
| Dyslipidemia | N (%) | 6 (60.00) | 5 (62.50) | 0.914 |
| Type 2 diabetes mellitus | N (%) | 2 (20.00) | 0 (0.00) | 0.477 |
| High blood pressure | N (%) | 7 (70.00) | 4 (50.00) | 0.630 |
| Body mass index | Mean ± SD (kg/sqm) | 25.65 ± 2.74 | 24.75 ± 6.98 | 0.712 |
| Fasting glycaemia | Mean ± SD (mg/dL) | 104.35 ± 28.51 | 106.13 ± 22.71 | 0.803 |
| Glycated hemoglobin | Mean ± SD (%) | 5.46 ± 0.34 | 5.30 ± 0.36 | 0.487 |
| Serum creatinine | Mean ± SD (mg/dL) | 0.73 ± 0.17 | 0.82 ± 0.20 | 0.125 |
| Serum sodium | Mean ± SD (mmol/L) | 141.00 ± 2.16 | 140.50 ± 1.00 | 0.689 |
| Serum potassium | Mean ± SD (mmol/L) | 4.35 ± 0.33 | 4.31 ± 0.45 | 0.903 |
| Total serum calcium | Mean ± SD (mg/dL) | 9.70 ± 0.39 | 9.42 ± 0.28 | 0.134 |
| Ionized serum calcium | Mean ± SD (mg/dL) | 4.27 ± 0.16 | 4.05 ± 0.19 | 0.053 |
| Serum phosphorus | Mean ± SD (mg/dL) | 3.77 ± 0.50 | 3.66 ± 0.49 | 0.716 |
| Serum magnesium | Mean ± SD (mg/dL) | 1.95 ± 0.22 | 2.03 ± 0.13 | 0.588 |
| 25-hydroxyvitamin D | Mean ± SD (ng/mL) | 22.78 ± 8.44 | 22.87 ± 6.03 | 0.979 |
| Parathormone | Mean ± SD (pg/mL) | 41.43 ± 17.29 | 39.12 ± 18.56 | 0.820 |
| Osteocalcin | Median (Q1, Q3) (ng/mL) | 27.65 (15.11, 36.29) | 25.71 (16.77, 40.25) | 0.684 |
| Alkaline phosphatase | Mean ± SD (U/L) | 86.67 ± 29.44 | 81.83 ± 39.12 | 0.789 |
| P1NP | Median (Q1, Q3) (ng/mL) | 69.35 (29.59, 71.78) | 101.68 (50.35, 153.00) | 0.175 |
| CrossLaps | Median (Q1, Q3) (ng/mL) | 0.37 (0.30, 0.78) | 0.58 (0.46, 0.77) | 0.309 |
| Lumbar BMD | Mean ± SD (g/sqcm) | 0.849 ± 0.151 | 1.023 ± 0.185 | 0.042 |
| Lumbar T-score | Mean ± SD (SD) | -2.72 ± 1.22 | -1.30 ± 1.54 | 0.044 |
| Lumbar Z-score | Mean ± SD (SD) | -1.05 ± 1.34 | -0.10 ± 1.00 | 0.115 |
| Femoral neck BMD | Mean ± SD (g/sqcm) | 0.769 ± 0.082 | 0.839 ± 0.107 | 0.146 |
| Femoral neck T-score | Mean ± SD (SD) | -1.97 ± 0.64 | -1.44 ± 0.76 | 0.143 |
| Femoral neck Z-score | Mean ± SD (SD) | -0.23 ± 0.57 | -0.24 ± 0.39 | 0.960 |
| Total hip BMD | Mean ± SD (g/sqcm) | 0.823 ± 0.142 | 0.916 ± 0.130 | 0.194 |
| Total hip T-score | Mean ± SD (SD) | -1.50 ± 1.12 | -0.76 ± 1.03 | 0.184 |
| Total hip Z-score | Mean ± SD (SD) | -0.01 ± 1.02 | 0.13 ± 0.57 | 0.750 |
In this study, we analysed a large spectrum of potential bone and metabolic contributors to falls and further on to osteoporosis and osteoporotic fractures. Our findings showed that the general cardiovascular and glucose profile, including glycaemia and glycated haemoglobin A1c, as well as sodium assays, were similar in group F versus nonF, while age and menopause duration were statistically significant higher (66.72 ± 9.44 versus 60.83 ± 6.07, p = 0.026, respectively, 21.33 ± 11.97 versus 13.70 ± 8.26 years, p = 0.024). Hypoestrogenic status (since subjects with hormone replacement therapy were ruled out) represents a traditional menopause-related contributor to reduced bone strength, but not necessarily to an elevated risk of falls [20,21]. Age distribution according to five-year age-groups was statistically significantly different (p = 0.017); in the 70-74 years interval, 75% of the individuals were from group F, while in the 50-54 year interval, 83.33% of them were from group nonF. Of note, type 2 diabetes had a relatively low rate (varying between 4.17% in the entire cohort to a maximum of 11.11% in group F) at an average body mass index of 25 kg/sqm in each subgroup. On the contrary, arterial hypertension was registered in more than 60% of the people, a condition that may be complicated by falls in cases with diurnal variations of the blood pressure [22,23].
The analysis of the (blood) mineral metabolism and bone turnover markers pinpointed a similar landscape in patients with fractures when compared to those who were fracture-free. Vitamin D status, as a potential interplay with falls and fractures, highlighted an overall insufficiency (with average values in between 20 and 30 ng/mL). We did not quantify the daily vitamin D replacements since the available 25-hydroxyvitamin D represents the best pointer of the overall D-metabolism in individuals with normal kidney function and who are hyperparathyroidism-free [24-26].
This study also showed that, among the panel of analysed parameters, DXA-BMD remains the main discriminator: femoral neck T-score was lower in group F versus nonF (-1.75 ± 0.72 versus -1.17 ± 0.91, p = 0.029), while receiver operating characteristic curve of femoral neck T-score for predicting a fragility fracture showed an area under the curve of 0.691 (p = 0.031). Moreover, patients with prevalent vertebral fractures had a statistically significant lower lumbar BMD and T-score versus those with non-vertebral fractures (0.849 ± 0.151 versus 1.023 ± 0.185 g/sqcm, p = 0.042, respectively, -2.72 ± 1.22 versus -1.30 ± 1.54, p = 0.044). These DXA-derived results confirm the general data from literature, as well as the fact that the most prevalent fractures in a population with a mean age of 63.04 ± 7.95 years, vertebral fractures represent the most frequent site [27,28].
When it comes to active fracture prevention, the presence of an osteoporotic fracture clearly indicates the initiation of an anti-fracture drug, and, in this cohort, we identified patients who were anti-osteoporosis medication candidates, yet they were not treated so far. This treatment gap represents a major burden of the osteoporotic landscape nowadays, even in developed countries [29,30]. Notably, our country has one of the lowest rates of DXA devices per population, and this might also contribute to the delay of medication initiation [19,30]. Also, the reimbursement of medication to reduce the fracture risk is applied based on DXA results, specifically, the diagnosis of osteoporosis, and, in this instance, only 55% of the patients were identified with osteoporosis at DXA in group F. On the other hand, osteoporosis (uncomplicated with fractures) was also confirmed to have a lower prevalence (of 16.67%) in group nonF, and this finding requires drug initiation as the primary fracture prevention level in this instance. In addition to controlling the risk factors/associated ailments and improving the BMD, fall prevention also includes complex rehabilitation programs, as well as home care devices/services for surveillance [31-33].
A recent study published in 2025 showed that the prediction of a hip fracture as provided by the femoral neck bone mineral density in females, respectively, males is of 66.9%, respectively, of 66.5% (mean female population age of 72.5 years, respectively, of 72.3 years for males) [34]. Of note, hip represents a better predictor of hip fractures than lumbar spine bone mineral density, which, otherwise, stands for a better predictor of vertebral fractures [35]. Recently, predictive models based on deep learning machines were proposed for further study as replacements for single bone mineral density at DXA in order to achieve an adequate prediction of fragility fractures [36]. Moreover, Prince et al. [37] showed that other DXA parameters (than bone mineral density/T-score) might help de prediction of a femoral neck fracture: for instance, in 69 individuals who suffered a femoral neck fracture within the following 10 years, respectively, 59 participants who underwent a trochanter fracture (versus controls who were fracture-free) areal bone mineral density at baseline hip DXA was 7% lower at femoral neck for the first category of study population, respectively, 15% lower for the second category [37].
As a limitation, we mention the sample size and the retrospective design. Of note, we applied numerous exclusion criteria in order to obtain an adequate analysis of this real-life setting and to eliminate the bias that comes from integrating the detection of a fragility fracture upon a recent fall. Generally, the falls, as potential contributors to the fracture risk, are less likely to be clarified in daily practice, nor controlled, since numerous elements might be involved, such as, in this case, diabetes, high blood pressure, or even older age. Osteosarcopenia might be co-present, too, in these patients, and hence, the assessment of the muscle status in addition to a low BMD might help the understanding of this pathogenic loop in falls [32,33].
Menopausal women who suffered a fall during the last 12 months and who were further identified with an osteoporotic fracture were older and showed a longer menopause duration when compared to those who were fracture-free. The prevalence of type 2 diabetes and high blood pressure was similar, as well as vitamin D and bone turnover markers. A lower BMD was found at the femoral neck, while the individuals with vertebral fractures (which were the most common types) showed a lower lumbar BMD versus those with non-vertebral fractures. Further prospective, larger trials are necessary to pinpoint the burden of falls in real-life settings and to address the anti-osteoporotic therapy gaps.
Not applicable.
Conceptualization, M.-L.C., O.-C.S., M.K., M.C., E.-M.P., D.-M.P., and A.V.; methodology, M.-L.C., O.-C.S., M.K., M.C., E.-M.P., D.-M.P., and A.V.; software, M.-L.C., O.-C.S., M.K., M.C., E.-M.P., D.-M.P., and A.V.; validation, A.V.; formal analysis, M.-L.C., and A.V.; investigation, M.-L.C., O.-C.S., M.K. (radiologic assessment), M.C., E.-M.P. (radiologic assessment); resources, O.-C.S., and M.C.; data curation, M.-L.C., D.-M.P., and A.V.; writing—original draft preparation, O.-C.S., and M.C.; writing—review and editing, M.-L.C., D.-M.P., and A.V.; visualization, M.-L.C., O.-C.S., D.-M.P., and A.V.; supervision, M.-L.C.; project administration, A.V.; funding acquisition, M.-L.C., O.-C.S., M.K., M.C., E.M.P., D.-M.P., and A.V. All authors have read and agreed to the published version of the manuscript. No generative AI was involved in the production of this article.
This research received no external funding.
(ethical approval 33 from 09/29/2025)
Not applicable due to the retrospective design of the study.
All available data are within the article.
This is part of the PhD research with the theme: “Non-invasive techniques for identification of osteoporotic fracture risk in menopause” – PhD contract number 28086 from 9 September 2024 (“Carol Davila” University of Medicine and Pharmacy, Bucharest, Romania). No generative AI was used to prepare this article.
The authors declare no conflict of interest.