
One of the most intense areas of research in the modern era involves the skeletal muscle status, which became the novel endocrine gland of interest, noting that the complex spectrum of muscle-released exerkines (or myokines) dramatically changed with the detection of irisin in 2012 by Boström et al. [1-3]. Irisin was first identified as being secreted amid exposure to extreme conditions, particularly cold and physical exercise, but recently its blood level was analyzed in relation to various ailments in order to become a biomarker or prognostic marker in daily practice, independently of the triggers such as extreme environments/conditioning programs [4-6].
Irisin is released from a larger precursor fibronectin type III domain-containing protein 5 (FNDC5) by activation due to transcriptional co-activator peroxisome proliferator-activated receptor-γ (PPAR-γ) co-activator-1 (PGC1-α), while adenosine monophosphate-activated (AMP) protein kinase, a main regulator of nutrient homeostasis, also activates irisin [7-9]. The current level of pathogenic knowledge primarily involves the role of irisin in transforming beige adipocytes into brown adipocytes, which further offers the substrate to produce heat from fatty acids and glucose in the human body [10-12]. (Figure 1)
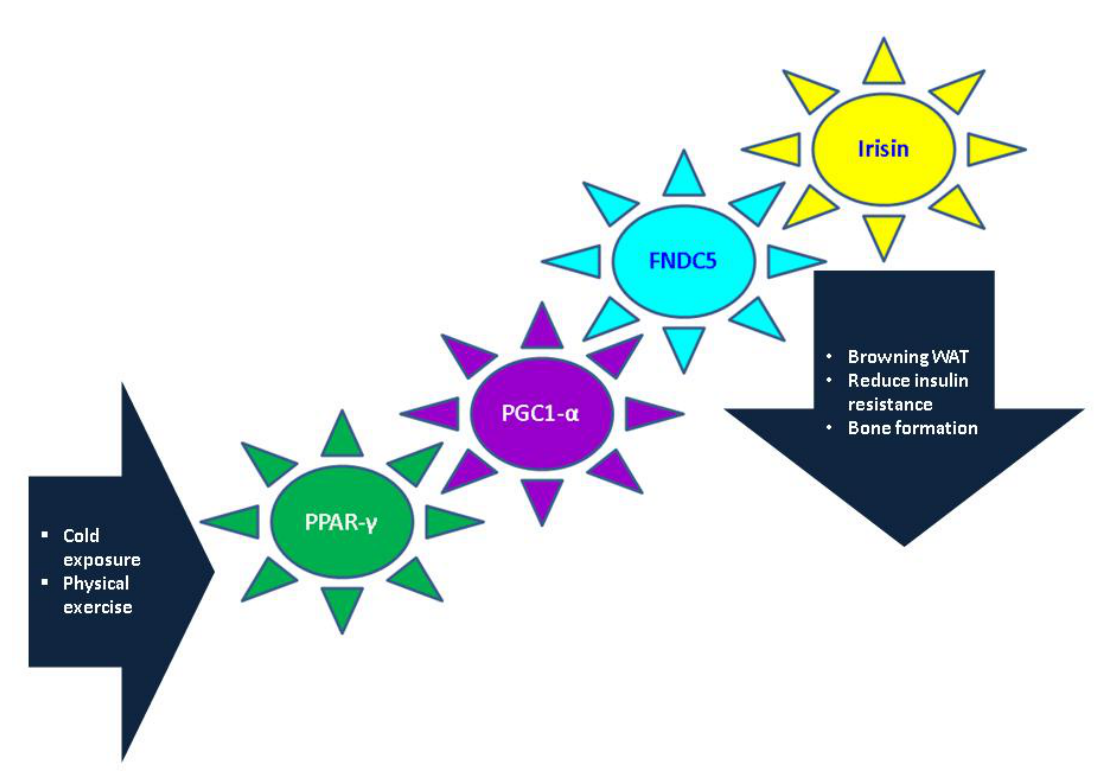
The most well-known stimulus of this physiological process is represented by the muscle activity and cold exposure [13,14]. This loop of regulating brown adipose tissue (BAT) thermogenesis is sustained by other peripheral mechanisms involving molecules such as leptin and fibroblast growth factor 21 (FGF21) in addition to the central thermogenesis [15-17]. On the contrary, the inhibitors of BAT thermogenesis are ghrelin, adiponectin, and plasminogen activator inhibitor-1 [18,19].
Overall, beige adipocytes, as a core element of thermogenesis upon browning of the white adipose tissue, are activated by myokines (e.g., irisin, interleukin-6), hepatokines (e.g., FGF21), cardiac proteins (e.g. brain natriuretic peptide), and neuronal pathways underlying sympathetic inputs (which are activated by cold exposure or adipokine leptin release, etc.) [20-21]. A combination of both cold and physical training induces body heat loss, with an improvement of the cardiovascular status and of the insulin resistance via irisin release from the muscle, as well as via activation of hepatic FGF21 (among others) [22-24]. However, this theoretical background is limited by an individual’s tolerance to cold and the genetic and epigenetic-based muscle ability to release the hormone irisin [25,26]. Notably, irisin and interleukin-6 are involved in oxidative stress and cellular antioxidant defences, as well as the anti-aging process [27]. Moreover, irisin and FGF21 are related to beta-klotho interplay, which offers a connection to the mineral metabolism signal transduction pathways [28,29]. The exerkine was found to act as a bone-forming agent via the Wnt-catenin pathway interference, and further research involves its practical applications as a bone marker or interventional trials with irisin as an anti-osteoporotic agent [28-31]. An impairment of the muscle activity might cause muscle-related insulin resistance, which may be complicated by type 2 diabetes and other metabolic ailments; hence, irisin seems to be situated in the centre of these complex bone and glucose cross-roads [32].
To date, only a limited number of clinical trials in humans addressed irisin testing in everyday practice, as opposed to the numerous data in animal experiments, particularly murine studies (due to the biochemical similarity to the human irisin).
In this pilot study, we aimed to analyze the blood irisin levels in relation to glucose, lipids, and mineral metabolism levels in menopausal women diagnosed with altered glucose regulation (other than diabetes): either impaired fasting glucose (IFG) or impaired glucose tolerance (IGT).
This study was a prospective, transversal, non-interventional, pilot, bi-centric (bi-country) study, conducted between December 2024 and October 2025 in two university hospitals.
We enrolled active, apparently healthy menopausal adults who underwent a complete biochemical and hormonal panel according to the study protocol amid hospitalization at either of the two university centers involved in the research. We included females aged between 50 and 80 years, who were confirmed with a physiological or surgical menopausal status, having at least one year since (hormone replacement-free) secondary amenorrhea, and provided a written consent to participate in the study. We excluded individuals who were previously diagnosed with osteoporosis or osteopenia, bone metabolic conditions, cancers, chronic renal failure, endocrine diseases, such as parathyroid tumour, Cushing’s disease, Cushing’s syndrome, acromegaly, or prolactinoma, as well as previous or current diagnosis of type 1, type 2, or secondary diabetes mellitus. Also, the subjects who underwent at any point in life the following medications and/or procedures were ruled out: corticotherapy, insulin therapy, anti-obesity and anti-diabetic drugs, bariatric surgery, therapy to prevent or act against osteoporosis or reduce osteoporotic (fragility) fracture risk, and/or reduce hypercalcemia (e.g., oral or intravenous bisphosphonates, teriparatide, denosumab, calcitonin, romosozumab, abaloparatide).
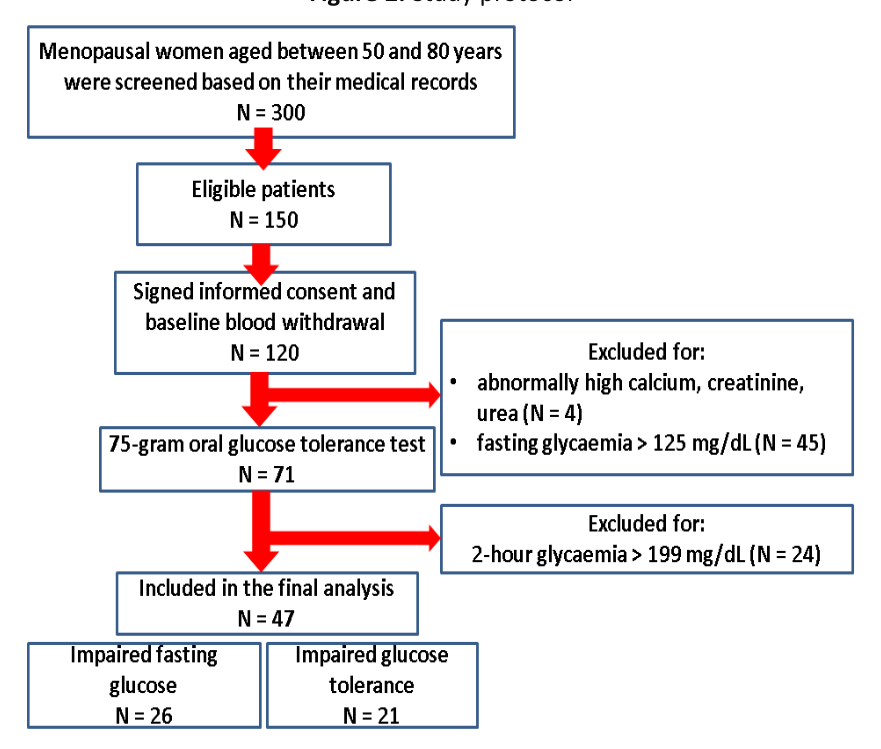
The anamnesis and medical records provided during hospitalization included the spectrum of inclusion and exclusion criteria in terms of previous diseases and medications. Further on, eligible participants signed the informed consent to be enrolled in the study. Then, the specific blood tests were performed, as follows: fasting blood withdrawal was applied after an 8-to-12-hour overnight fasting, followed by a 75-gram oral glucose tolerance test (OGTT). OGTT was performed only in the subjects who presented a fasting glycaemia of less than 125 mg/dL. During OGTT, two additional blood withdrawals were performed after one hour and after two hours since oral glucose administration. The subjects who experienced a level of 2-hour glycaemia of 200 mg/dL or above were ruled out. The females who were confirmed with either IFG or IGT were included in the final analysis if fasting glycaemia was identified at a level of >100 mg/dL and <126 mg/dL, respectively, the patients had a value of 2-hour glucose in OGTT of >140 and <200 mg/dL [33]. (Figure 2)
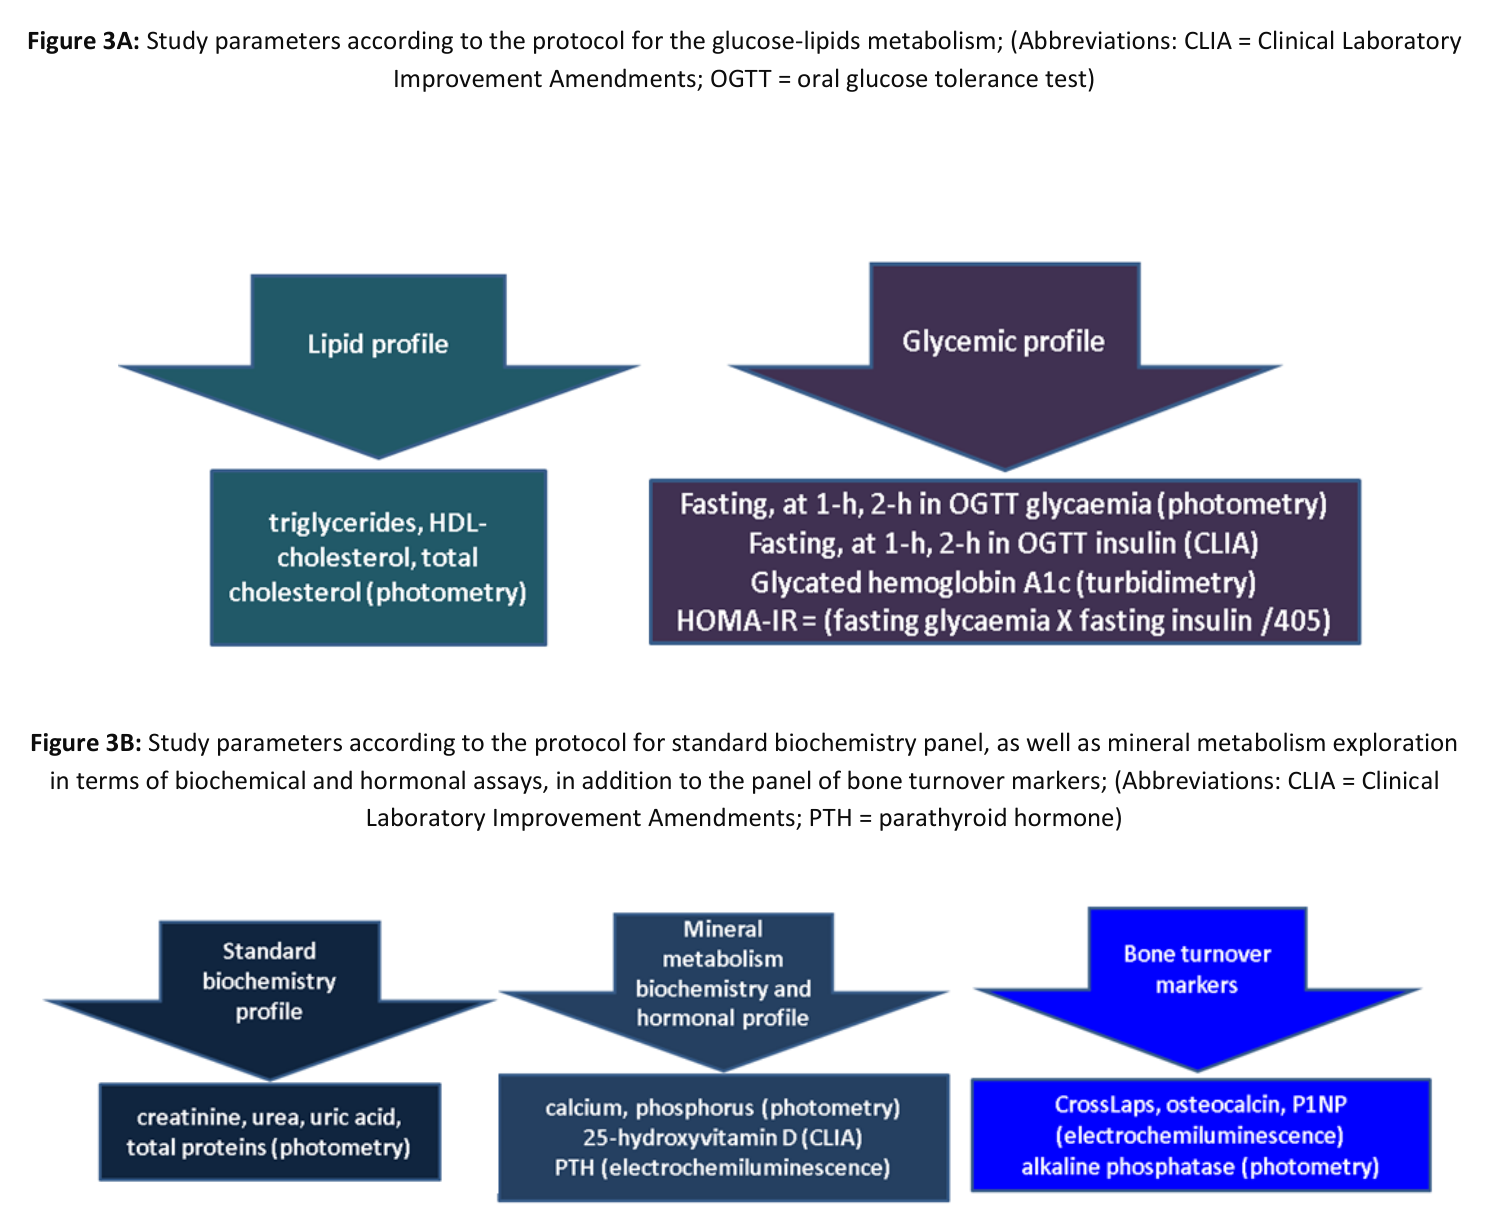
The following parameters were collected: age, years since menopause, body mass index (in kg/sqm), glucose and lipid profile, mineral metabolism biochemical and hormonal assays, and bone turnover makers. (Figure 3A and 3B)
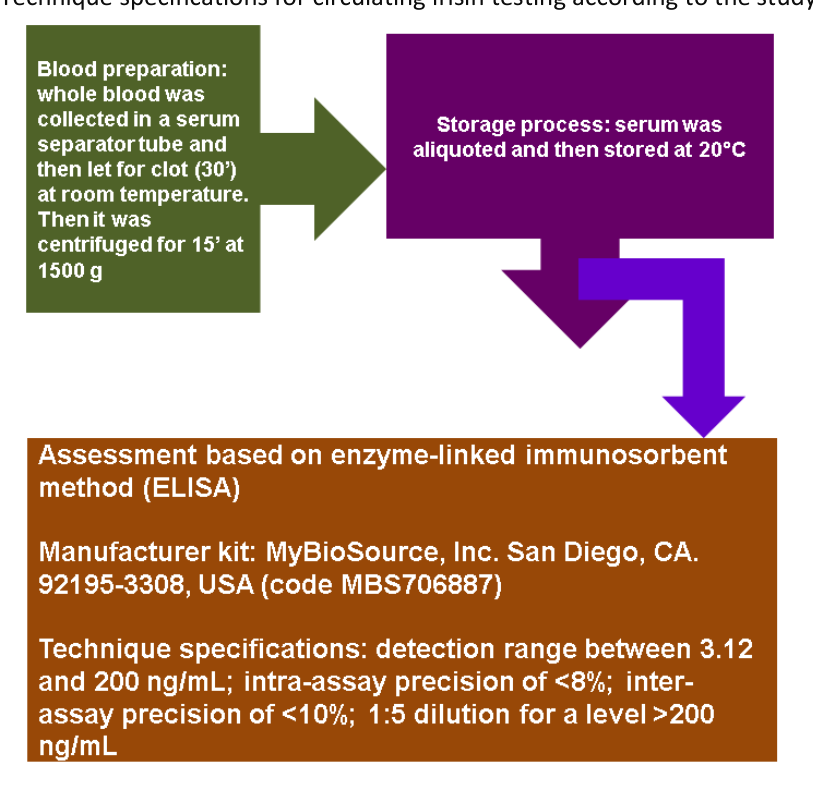
Irisin was tested based on the MyBioSource kit via the enzyme-linked immunosorbent method (ELISA), and all blood samples were collected at the “C.I. Parhon” National Institute of Endocrinology, Bucharest, Romania, which provided the infrastructure for all irisin assays. (Figure 4)
MedCalc® (Statistical Software version 23.3.7; MedCalc Software Ltd, Ostend, Belgium, 2025) was used for statistical analysis. Kolmogorov-Smirnov test was applied for normality/non-normality pattern, respectively, t-test for comparison of independent samples with normal distribution, as well as Mann-Whitney test for comparison of independent samples with non-normal distribution. The descriptive analysis (mean ± standard deviation) and Pearson correlation (for normal distribution), respectively, Spearman rank correlation (for non-normal distribution) were performed. The cut-off p < 0.05 established the statistical significance.
The study was ruled in accordance with the Declaration of Helsinki for medical research. Each patient signed the informed consent regarding participation in the study. Ethical Committees from each university center approved the study (number 32 from 09 September 2024 at “C.I. Parhon” National Institute of Endocrinology, Bucharest, Romania, and number 97 from 11 November 2024 at State “Nicolae Testemiţanu” University of Medicine and Pharmacy, Chisinau, Republic of Moldova).
The patients included in the final analysis were either found with IGT (N = 21) or IFG (N = 26). These two subgroups have a similar age (63 ± 9.24 versus 63.46 ± 8.16 years, p = 0.856) and menopause duration (14.05 ± 9.37 versus 16.76 ± 8.07 years, p = 0.297), as well as body mass index with mean values within the obesity range (34.84 ± 5.07 versus 31.34 ± 6.46 kg/sqm, p = 0.765). They were found with similar mineral metabolism assays and bone turnover markers, with an average 25-hydroxyvitamin D showing a mild insufficiency (28.62 ± 8.09 versus 28.06 ± 6.99 ng/mL, normal value above 30 ng/mL).
Glucose profile assessment was found statistically significantly increased 1-hour glycemia in the IGT group versus the IFG group (207.04 ± 34.72 versus 179.40 ± 33.91 mg/dL, p = 0.009). Fasting (baseline) insulin was statistically significantly higher in the IGT versus IFG group (13.00 ± 7.38 versus 8.36 ± 3.96 µUI/mL, p = 0.008; normal values between 1.9 and 23 µUI/mL), respectively, 2-hour insulin in OGTT (101.44 ± 67.26 versus 48.97 ± 34.35 µUI/mL, p = 001).
HOMA-IR was statistically significantly elevated in the IGT group when compared to the IFG group: 3.53 ± 2.32 versus 2.27 ± 1.17 (p = 0.21), with both mean levels sustaining insulin resistance. (Table 1)
| Parameter | Group IGT mean ± SD or median (IQR) |
Group IFG mean ± SD or median (IQR) |
p-value |
|---|---|---|---|
| Number of patients | 21 | 26 | |
| Demographic features | |||
| Age (years) | 63 ± 9.24 | 63.46 ± 8.16 | 0.856 |
| Years since menopause | 14.05 ± 9.37 | 16.76 ± 8.07 | 0.297 |
| Body mass index (kg/sqm) | 34.84 ± 5.07 | 31.34 ± 6.46 | 0.765 |
| Mineral metabolism and standard biochemical assays | |||
| Total calcium (mg/dL) | 9.57 ± 0.43 | 9.31 ± 1.34 | 0.400 |
| Phosphorus (mg/dL) | 3.42 ± 0.49 | 3.69 ± 0.62 | 0.114 |
| Total proteins (g/dL) | 7.50 ± 0.48 | 7.49 ± 0.47 | 0.904 |
| Creatinine (mg/dL) | 0.75 ± 0.17 | 0.77 ± 0.13 | 0.700 |
| Urea (mg/dL) | 40.16 ± 8.38 | 42.37 ± 12.10 | 0.481 |
| Uric acid (mg/dL) | 5.44 ± 1.20 | 7.20 ± 10.21 | 0.439 |
| Mineral metabolism hormones | |||
| parathyroid hormone (pg/mL) | 42.77 ± 11.45 | 47.26 ± 20.24 | 0.369 |
| 25-hydroxyvitamin D (ng/mL) | 28.62 ± 8.09 | 28.06 ± 6.99 | 0.781 |
| Bone turnover makers | |||
| total alkaline phosphatase (U/L) | 77.04 ± 28.71 | 76.62 ± 22.71 | 0.955 |
| osteocalcin (ng/mL) | 20.60 ± 7.70 | 76.62 ± 22.71 | 0.331 |
| P1NP (ng/mL) | 55.57 ± 20.47 | 62.20 ± 29.40 | 0.394 |
| CrossLaps (ng/mL) | 0.38 ± 0.18 | 0.41 ± 0.17 | 0.544 |
| Glucose metabolism assessment | |||
| Fasting glycaemia (mg/dL) | 108.35 ± 10.34 | 108.92 ± 6.25 | 0.816 |
| Glycaemia – at 1-hour in OGTT | 207.04 ± 34.72 | 179.40 ± 33.91 | 0.009 |
| Glycaemia – at 2 hours in OGTT | 162.61 ± 17.01 | 117.41 ± 18.81 | <0.0001 |
| Fasting insulin (µUI/mL) | 13.00 ± 7.38 | 8.36 ± 3.96 | 0.008 |
| Insulin – at 1-hour in OGTT | 94.67 ± 53.60 | 76.45 ± 44.43 | 0.219 |
| Insulin – at 2 hours in OGTT | 101.44 ± 67.26 | 48.97 ± 34.35 | 0.001 |
| Glycated hemoglobin A1c (%) | 5.89 ± 0.43 | 5.73 ± 0.30 | 0.144 |
| HOMA-IR | 3.53 ± 2.32 | 2.27 ± 1.17 | 0.021 |
| Lipid profile | |||
| Total cholesterol (mg/dL) | 202.46 ± 37.81 | 186.83 ± 55.06 | 0.256 |
| Triglycerides (mg/dL) | 125.31 ± 80.36 | 116.17 ± 52.66 | 0.655 |
| HDL-cholesterol (mg/dL) | 56.02 ± 14.79 | 57.87 ± 14.00 | 0.690 |
| Circulating irisin (ng/mL) | 133.78 ± 121.30 | 81.64 ± 69.57 | 0.07 |
Abreviations: HOMA-IR = Homeostasis Model Assessment of Insulin Resistance; OGTT = oral glucose tolerance test; Normal values: calcium = 8.8 – 10.2 mg/dL; phosphorus = 2.3 – 4.7 mg/dL; total proteins = 6.4 – 8.6 g/dL; creatinine = 0.5 – 1.2 mg/dL; urea = 22 – 43 mg/dL; uric acid = 2.6 – 6 mg/dL; parathormone = 17.3 – 74.1 pg/mL; 25-hydroxyvitamin D = >30 ng/mL; total alkaline phosphatase = 35 – 104 U/L; osteocalcin = 15 – 46 ng/mL; P1NP = 20.25 – 76.31ng/mL; CrossLaps = ng/mL; glycemia 80 – 115 mg/dL; fasting insulin = 1.9 – 23 µUI/mL; glycated hemoglobin A1c = 4.8 – 5.9%; HOMA-IR < 2; total cholesterol <200 mg/dL; tryglicerides <150 mg/dL; HDL-cholesterol = 35 – 65 mg/dL
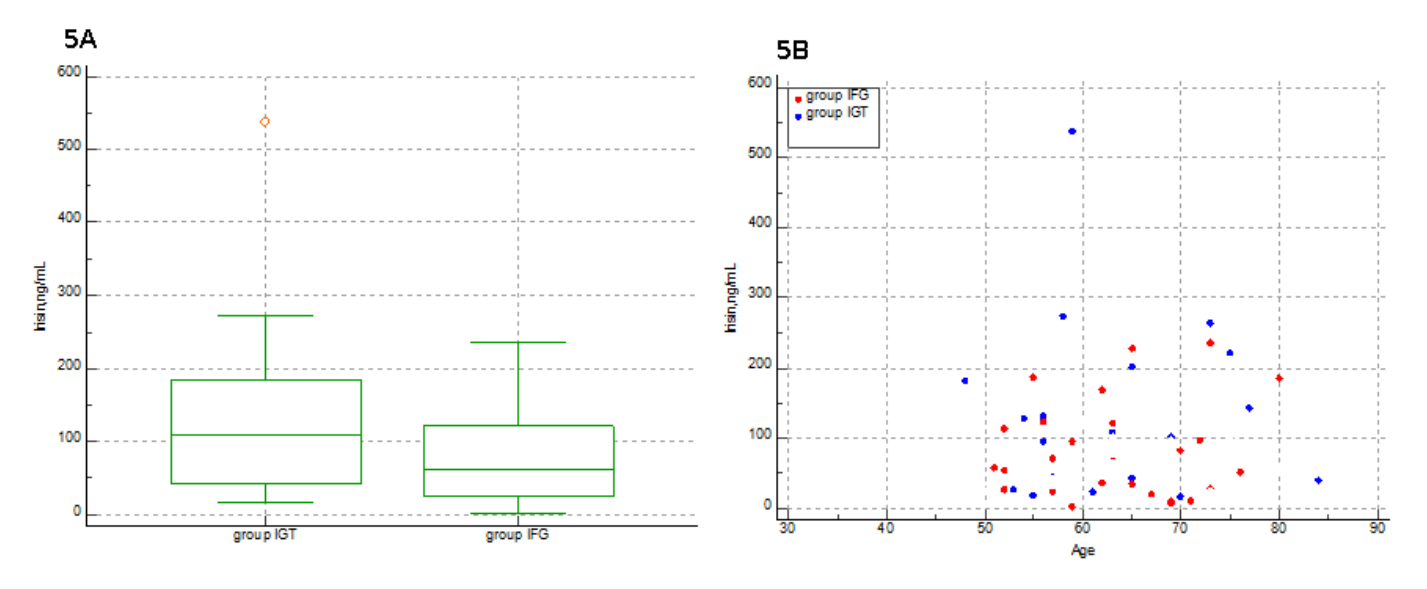
Circulating irisin was borderline elevated in the IGT group in comparison with the IFG group: 133.78 ± 121.30 versus 81.64 ± 69.57 ng/mL (p = 0.07). (Figure 5)
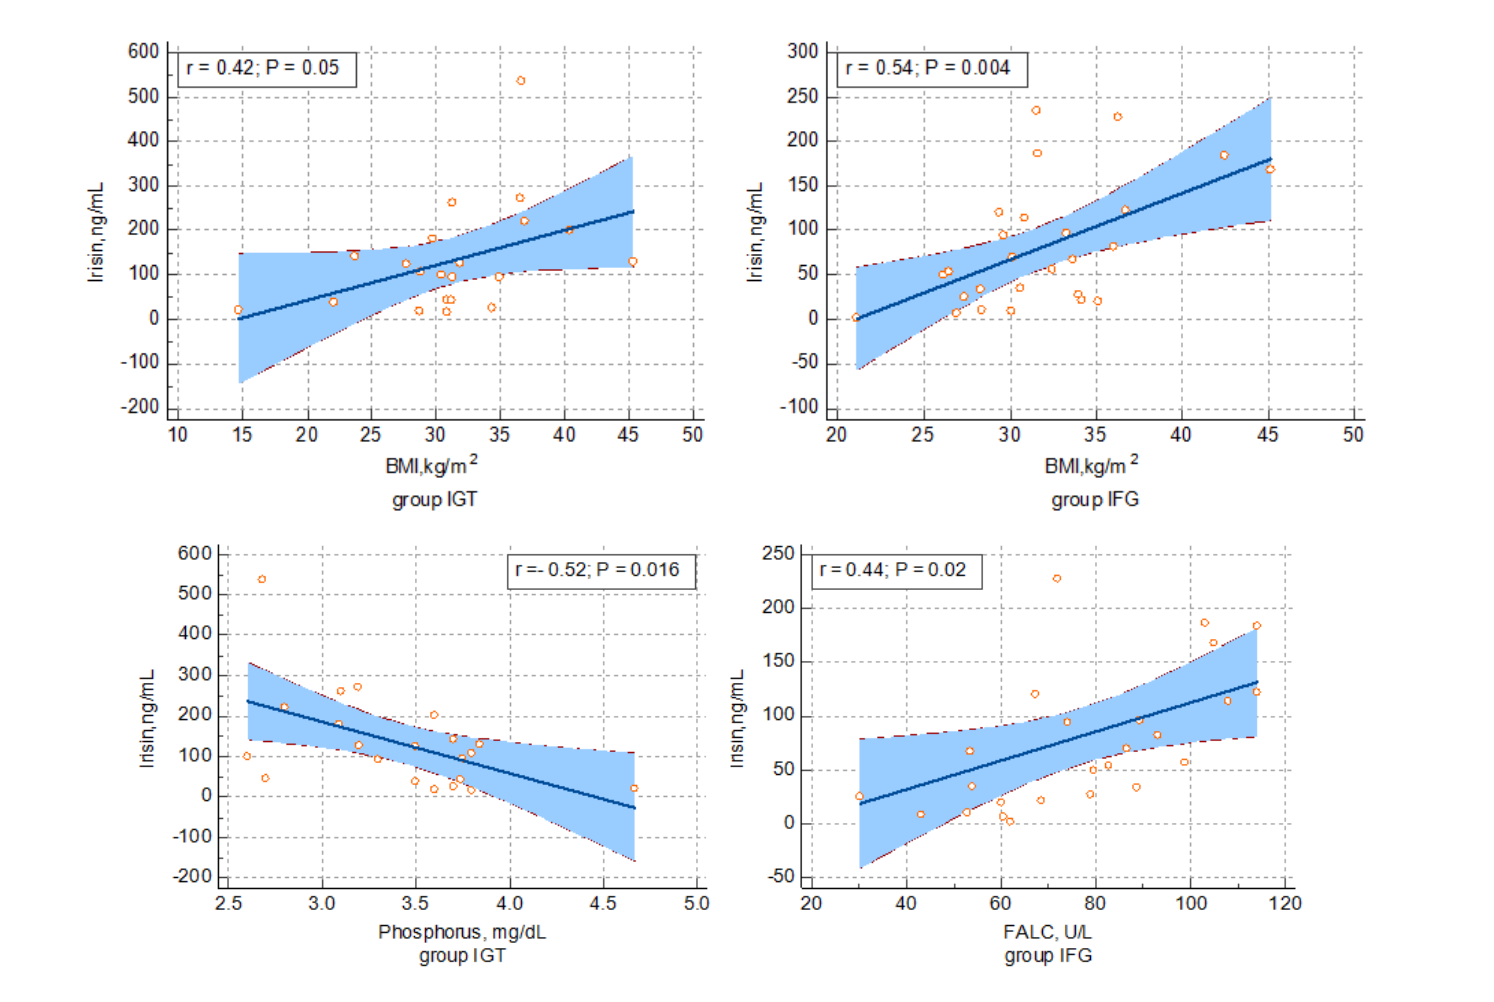
Irisin statistically significantly and positively correlated with body mass index (r = 0.42, p = 0.05 in the IGT group, respectively, r = 0.54, p = 0.004 in the IGF group). (Table 2)
| Irisin correlation with: | Group IGT | Group IFG |
|---|---|---|
| Age (years) | r = -0.03 p = 0.89 |
r = 0.095 p = 0.64 |
| Menopause duration (years since menopause) | r = -0.001 p = 0.99 |
r = -0.02 p = 0.88 |
| Body mass index (kg/sqm) | r = 0.42 p = 0.05 |
r = 0.54 p = 0.004 |
| Total serum calcium (mg/dL) | r = 0.04 p = 0.84 |
r = -0.36 p = 0.07 |
| Phosphorus (mg/dL) | r = -0.52 p = 0.01 |
r = 0.168 p = 0.42 |
| Uric acid (mg/dL) | r = 0.09 p = 0.69 |
r = 0.16 p = 0.44 |
| Parathyroid hormone (pg/mL) | r = -0.28 p = 0.21 |
r = 0.30 p = 0.12 |
| 25-hydroxyvitamin D (ng/mL) | r = -0.19 p = 0.40 |
r = 0.04 p = 0.83 |
| Total alkaline phosphatase (U/L) | r = -0.37 p = 0.09 |
r = 0.44 p = 0.02 |
| Osteocalcin (ng/mL) | r = -0.34 p = 0.12 |
r = 0.01 p = 0.93 |
| P1NP (ng/mL) | r = -0.28 p = 0.22 |
r = 0.01 p = 0.92 |
| CrossLaps (ng/mL) | r = -0.13 p = 0.55 |
r = 0.02 p = 0.90 |
| Fasting glycaemia (mg/dL) | r = -0.31 p = 0.16 |
r = 0.08 p = 0.68 |
| Glycaemia – at 1-hour in OGTT | r = 0.05 p = 0.81 |
r = 0.16 p = 0.42 |
| Glycaemia – at 2 hours in OGTT | r = -0.20 p = 0.37 |
r = -0.43 p = 0.02 |
| Fasting insulin (µUI/mL) | r = 0.43 p = 0.05 |
r = 0.04 p = 0.83 |
| Insulin – at 1-hour in OGTT | r = 0.35 p = 0.12 |
r = 0.10 p = 0.60 |
| Insulin – at 2 hours in OGTT | r = 0.24 p = 0.31 |
r = -0.365 p = 0.06 |
| Glycated hemoglobin A1c (%) | r = 0.20 p = 0.37 |
r = 0.03 p = 0.85 |
| HOMA-IR | r = 0.30 p = 0.18 |
r = 0.05 p = 0.77 |
| Total cholesterol | r = -0.16 p = 0.48 |
r = 0.04 p = 0.81 |
| Triglycerides | r = 0.13 p = 0.57 |
r = -0.03 p = 0.87 |
| HDL-cholesterol | r = -0.03 p = 0.88 |
r = 0.26 p = 0.22 |
Irisin statistically significantly and positively correlated with total alkaline phosphatase (r = 0.44, p = 0.02) in the IGF group, and negatively with serum phosphorus (r = -0.52, p = 0.01) in the IGT group. (Figure 6)
In this pilot study (N = 47), we assessed menopausal pre-diabetic women with regard to the irisin assay in order to potentially find its utility in relation to glucose and mineral metabolism exploration. We identified a marginally different irisin level between IGT and IFG, which were age-matched groups. A more severe glucose status was pointed out in IGT versus IFG in terms of presenting higher onehour glucose and two-hour insulin levels during OGTT, fasting insulin, as well as HOMA-IR.
Notably, the hypothesis that irisin might serve as a biomarker in prediabetes is still under research nowadays, and only heterogeneous results have been published so far. For instance, Ertuna et al. [34] enrolled 100 participants aged between 18 and 65 years (60 of them were confirmed with prediabetes and 40 were prediabetes/diabetes-free), followed for a three-month protocol of a healthy lifestyle. Irisin statistically significantly increased after three months (p < 0.001), and provided a diagnosis performance similar to HOMA index (sensitivity of 93.3%, specificity of 65%), while originally being lower in prediabetes than controls [34]. Moreover, Liu et al. [35] studied 41 males with prediabetes (mean age of 37.8 years) versus 45 men with normal results during OGTT (average age of 37.1 years), and identified a correlation between irisin and fasting glycaemia (r = -0.725, p < 0.05), and two-hour glycaemia during OGTT (r = -0.36, p < 0.05) only in the group confirmed with prediabetes [35]. In the REACTION study, He et al. [36] included 2350 newly diagnosed subjects with prediabetes and found that irisin was an independent predictor of developing diabetes, and a decrease in the basal level above the median irisin value was associated with a higher risk of diabetes (odds ratio of 5.077, 95% confidence interval between 2.112 and 12.206) [36]. Other observational studies also provided inconclusive results of irisin testing in prediabetes, mostly noting that a lower level of the protein is associated with a more severe picture of glucose anomalies [37].
Interestingly, we found a positive correlation between irisin and body mass index in both groups with prediabetes (r = 0.42, p = 0.05 in the IGT group, respectively, r =0.54, p = 0.004 in the IGF group). Pardo et al. [38] showed that a more accurate correlation should be expected with body fat rather than body mass index [38]. Stengel et al. [39] identified a higher irisin in the obese versus the normalweight population, with a positive correlation coefficient (r = 0.5, p < 0.01), which was similar to our results [39]. On the contrary, we previously mentioned the study conducted by Liu et al. [35] that confirmed a negative correlation between irisin and body mass index (r = -0.325, p < 0.05) only in the control (diabetes-negative) group, and not in the one with prediabetes [35].
We found no statistically significant results with respect to irisin and the lipid profile, while generally, a limited number of studies showed statistically significant results. For example, a small sample size study identified a correlation between irisin and triglycerides of -0.339 (p < 0.05) only in the control male group, not in the men cohort diagnosed with prediabetes, whereas a positive correlation with HDL-cholesterol was found (r = 0.432, p < 0.05) [35]. Another study in diabetic and obese participants identified that a lower irisin was associated with a higher level of triglycerides (r = -0.343, p = 0.024), and lower HDL-cholesterol (r = 0.363, p = 0.17) [40]. Additionally, Fu et al. [41] suggested that irisin is reduced in patients with carotid atherosclerosis [41].
With regard to the exploration of the mineral metabolism and the spectrum of traditional bone turnover markers, only alkaline phosphatase correlated with irisin in the IGF group (r = 0.44, p = 0.02), while lower phosphorus levels were associated with higher irisin in the IGT group r = -0.52, p = 0.01). Based on our findings, irisin should be differently positioned with the calcium-phosphorus assessment in the two categories of prediabetes. Many of the current studies focus on reporting the irisin, osteocalcin, and P1NP improvement upon physical training since they act as bone-forming contributors [42] or their profile in type 2 diabetic populations, which is expected to reduce their blood levels [43]. In the previously mentioned study, irisin positively correlated with P1NP (r = 0.398, p < 0.05), respectively, with osteocalcin (r = 0.351, p < 0.05) in males with prediabetes [35].
At limitations of this study, we mention the cross-sectional design in a relatively small sample size. This pilot study will be followed by a larger trial to pinpoint the impact of irisin testing in daily practice, not only in pre-diabetic, but also in type 2 diabetic subjects. Notably, we restricted enrollment to menopausal adults in order to avoid the bias of inter-individual variations in women of reproductive age and males with respect to the bone health assessment (specifically, the panel of bone turnover markers) and multiple hormonal influences such as estrogens, progesterone, and testosterone status [44].
Also, we did not quantify the level of daily (physical training), which might impact the baseline irisin value. Prior data suggested that improvement of the insulin resistance amid physical exercise might involve an increase in irisin, while the overall results are not homogeneous [45]. Moreover, at this point, many irisin assay variations are caused by a lack of standardization with respect to the method and kit of detection, and further studies are necessary.
Among the panel of glucose, lipids, and mineral metabolism parameters, we found in this pilot study that, despite a marginally significant higher irisin in IGT versus IFG, the hormone correlated with body mass index in both groups, and only selectively with mineral metabolism assays, and none of the glucose status biomarkers. To our best knowledge, only a limited number of well-designed prospective studies have been published so far in the field of prediabetes and the results are still inhomogeneous depending on the study population, variations of irisin kits, as well as known or unknown biases of detection such as co-morbidities, hormonal influences, muscle status variations in terms of mass, function, and level of training as well as body composition analysis.
Not applicable
Conceptualization, D.M., A.P., N.L.-O., L.S., M.C., S.V.S., O.-C.S., and V.C.; methodology, D.M., A.P., N.L.-O., L.S., M.C., S.V.S., O.-C.S., V.C., D.-M.P., and M.-L.C.; software, D.M., A.P., N.L.-O., L.S., M.C., S.V.S., O.-C.S., and V.C.; validation, D.-M.P., and M.-L.C.; formal analysis, D.M., A.P., N.L.-O., L.S., M.C., S.V.S., O.-C.S., and V.C.; investigation, D.M., A.P., N.L.-O., L.S., M.C., S.V.S., O.-C.S., V.C., D.-M.P., and M.-L.C.; resources, D.M., A.P., N.L.-O., L.S., M.C., S.V.S., O.-C.S., V.C.; data curation, D.-M.P., and M.-L.C.; writing—original draft preparation, D.M., and M.C; writing—review and editing, M.C.; visualization, D.-M.P., and M.-L.C.; supervision, D.M., A.P., N.L.-O., L.S., M.C., S.V.S., O.-C.S., V.C., D.-M.P., and M.-L.C.; project administration, M.C.; funding acquisition, M.C.; All authors have read and agreed to the published version of the manuscript. No generative AI was involved in the production of this article.
This work was supported by the project PN-IV-P8-8.3-ROMD-2023-0262.
The research was conducted in accordance with the Declaration of Helsinki. Each patient signed the informed consent in order to be enrolled in the study. The study was approved by the Ethical Boards of both centers (number 32 from 30 September 2024 at “C.I. Parhon” National Institute of Endocrinology, Bucharest, Romania, respectively, number 97 from 20 November 2024 at State “Nicolae Testemiţanu” University of Medicine and Pharmacy, Chisinau, Republic of Moldova).
The patients signed the informed consent to participate in this study.
All available data are in the article.
This is part of the project PN-IV-P8-8.3-ROMD-2023-0262 and a collaboration amid PhD research entitled “Non-invasive techniques for identification of osteoporotic fracture risk in menopause” (contract number 28086 from 9 September 2024). No generative AI was used to prepare this article.
The authors declare no conflict of interest.